Topics
Intelligence and Ability
- Concept of Intelligence
- Nature of Intelligence in the Indian Context
- Judging Intelligence from Behaviour
- Measurement of Intelligence
- Mental Age
- Intelligence Quotient
- Intelligent Tests
- Types of Intelligence Tests
- Individual Test
- Group Test
- Verbal Test
- Non-Verbal Test
- Infant Intelligence Tests
- Culture Bias and Culture Fair Tests
- Non-Verbal Test> Raven's Progressive Matrices Test
- Validity of Intelligence Tests
- Levels of Intelligence
- Implications of Intelligence Levels
- Characteristics of Gifted Children
- Distribution of I.Q.s in the Population
- Constancy of I.Q.
- Age and Intelligence
- Significance and Implications of Intelligence Levels
- Determinants of Intelligence
- Hereditary Factors
- Hereditary Factors> Jensen’s Theory
- Environmental Factors
- Environmental Factors> Indian Studies on Environment and Intelligence
- Environmental Factors> Culture
- Environmental Factors> Sex Differences
- Environmental Factors> Health
- Environmental Factors> Family Size
- Environmental Factors> Social Deprivation
- Environmental Factors> Socio-economic Status
- Theories of Intelligence
- Charles Spearman's Two Factor Theory
- Louis Thurstone’s Multifactor Theory
- Guilford's Structural Model Theory
- E. L. Thorndike's Theory
- Modern Theories of Intelligence
- Howard Gardner's Multiple Intelligence Theory
- Sternberg’s Triarchic Theory
- Theory of Intelligence by Cattell
- The Pass Theory of Intelligence
- New Trends in Intelligence> Emotional Intelligence
- Characteristics of Emotional Intelligent Person
- New Trends in Intelligence> Artificial Intelligence
- Creativity and Intelligence
- Characteristics of Creative Person
- Factors Affecting Creativity
- Relation Between Creativity and Intelligence
- Concept of Aptitude
- Types of Aptitude Tools
- Types of Aptitude Test> General Aptitude Test Battery (GATB)
- Types of Aptitude Test> Differential Aptitude Test (DAT)
- Types of Aptitude Test> Special Aptitude Test
- Achievement Tests
- Uses of Achievement Tests
- Batteries of Achievement Tests
- Combination of Aptitude-Achievement Batteries
- Concept of Interest
- Interest Tests
- Types of Interest Test Tools> Strong Vocational Interest Blank
- Types of Interest Test Tools> Strong-Campbell Interest Inventory (1974)
- Comparison of Aptitude, Achievement, and Interest Tests
Personality
- Concept of Personality
- Psychological System
- Characteristics of Personality
- Personality Related Terms
- Classification of Personality
- Friedman's Theory of Personality
- Charak Samhita's of Ayurveda Theory of Personality
- Charak Samhita's of Ayurveda Theory of Personality> Personality Type of Charaka and Sushruta
- Charak Samhita's of Ayurveda Theory of Personality> Personality Types based on Triguna
- Kretschmer's Theory of Personality
- Sheldon’s Theory of Personality
- Determinants of Personality
- Situational Determinants
- Situational Determinants> Role of Home
- Situational Determinants> Effect of School and Education
- Situational Determinants> Sibling Rivalry
- Environmental Factors> Socio-economic Status
- Measurement of Personality
- Psychometric Tests
- Psychometric Tests> Questionnaires/Self Report Inventories
- Psychometric Tests> Use of Self-Report Inventories
- Psychometric Tests> Minnesota Multiphasic Personality Inventory (MMPI)
- Behavioural Analysis
- Projective Techniques
- Projective Techniques> Impressive
- Projective Techniques> Interpretive
- Rorschach Test
- Thematic Apperception Test
- Rosenzweig Picture Frustration Test
- Kahn Test of Symbol Digit Arrangement
- Word Association Test
- C.A.T. (Children’s Apperception Test)
- Indian Personality Tests
- Types of Personalities
- Theories of Personality
- Freud's Psychoanalytic Theory of Personality
- Freud's Psychoanalytic Theory of Personality> Pre-conscious or Sub-Conscious
- Freud's Psychoanalytic Theory of Personality> Structure of Freud's Theory of Personality
- Freud's Psychoanalytic Theory of Personality> Stages of Personality Development
- Phallic Stage
- Genital Stage
- Neo-Freudian Theory of Personality
- Carl Jung’s Theory of Personality
- A. Adler's Theory of Personality (1870-1937)
- Erik Erikson's Theory of Psycho-Social Development
- Karen Horney (1950)
- Humanistic Approach
- Carl Roger's Self Theory
- Maslow’s Theory of Self Actualization
- Descriptive Personality Theories
- Type Theories
- Type Theory> Jung's Type Theory
- Extroverts
- Introverts
- Ambiverts
- Type Theory> Hippocrates' Type Theory of Personality
- Type Theory> Eysenck Concept of Personality
- Trait Theories
- Trait Theory> Cattell’s Concept of Personality
- Catell's Concept of Personality> Criticism and Evaluation of Cattell’s Trait Theory
- Social Cognition and Social Learning Theories
- Social Learning Theory of Bandura
- Social Learning Theory by Julian Rotter (1954, 1982)
- Improving Social Skills through Imitation and Observation
- Trait Theory> Trait Theory of G. Allport
- Trait Theory> Types of Traits
- Trait Theory> Dimensions of Personality
Life Span Development
- Concept of Life Span Development
- Growth and Development of Life
- Principles and Characteristics of Development
- Trends of Development
- Factors Influencing Development
- Importance of Studying Childhood Development
- Maturation and Learning or Heredity and Environment
- Genetic Bases of Development
- Chromosome
- Genes
- Mechanism of Heredity Transmission
- Sex Determination
- Effect of Heredity on Human Beings
- Personality
- Concept of Intelligence
- Importance of Heredity in Development
- Heredity's Role in Human Development
- Environment's Role in Human Development
- Interaction between Heredity and Environment
- Bronfenbrenner's Ecological System Theory
- Levels of Ecological System
- Bronfenbrenner’s Views and Applications
- Technology and Ecological System
- Stages of Development> Period of Infancy
- Stages of Development> Prenatal Developmental Period
- Crying and Breathing
- Functions of Vital Organs
- Temperature
- Sensory Development of the Neonate
- Sensory Development of the Neonate> Reaction to Sound
- Sensory Development of the Neonate> Smell and Taste
- Sensory Development of the Neonate> Temperature
- Sensory Development of the Neonate> Pain
- Sex Differences in Development
- Activities and Needs of the Infant
- Perceptual Development of the Infant
- Stages of Development> Babyhood
- Stages of Development> Childhood
- Concept of Adolescence
- Physical Development
- Height and Weight
- Development of Nervous System
- Motor Skills during Preschool Age
- Motor Development
- Locomotor Development
- Bipedal Locomotion
- Development of Motor Skills
- Objective Performance
- Motor Development during Infancy
- Piaget's Concept of Cognitive Development
- Piaget’s Stages of Cognitive Development
- Sensory-Motor Period
- Sensory-Motor Period> Internal Mental Combination (18-24 months)
- Pre-Operational Period
- Period of Intuitive Thought
- Concrete Operation Stage
- Formal Operation Stage (11 Years and Above)
- Emotional Development during Infancy and Childhood
- Characteristics of Emotions
- Development of Emotion
- Bridges’ Theory of Emotional Development (1932)
- Role of Maturation in Emotional Development
- Role of Learning and Imitation
- Concept and Nature of Attachment
- Growth of Attachment
- Formation of Attachment
- Role of Feeding in Attachment
- Smile and Attachment Behaviour
- Attachment and Anxiety
- Importance of Attachment to Child Development
- Mary Ainsworth's Strange Situation Test (1965)
- Beginning of Social Behaviour
- Reaction to Mother
- Social Behaviour During Early Childhood
- Social Behaviour Development: 0–2 Years
- Eighteenth Month to Two Years
- Early Childhood (2 yrs – 6 yrs)
- Role of Peers in Social Development
- Forms of Social Behaviour
- Development of Gender Identity
- Development of Gender Roles
- Gender Typing
- Adjustment Demands of Adolescence
- Gender Stereotypes
- Sexual Behaviour during Adolescence
- Major Concerns of Adolescence
- Gender Differences in Development
- Major Concerns of Adolescence > Delinquency
- Elements of Gender Differences
- Conscience and Moral Development
- Major Concerns of Adolescence > Substance Abuse
- Major Psychological Disorder> Eating Disorders
- Factors Influencing Conscience
- Bulimia Nervosa
- Morality and Conscience in Adolescence
- Piaget's View on Moral Development
- Anorexia Nervosa
- Kohlberg's View on Moral Development
- Kohlberg's Stages of Moral Development
- Critique of Kohlberg's Moral Reasoning Theory
- Features & Challenges of Adolescence
- Socio-Emotional Impact on Adolescents
- Interrelation of Physical Development, Social Acceptance, and Personality
- Cognitive Development during Adolescence
Stress and Stress Management
- Concept of Stress
- Nature of Stress
- Process of Stress
- Levels of Stress
- Concept of Stressors
- Types of Stressors
- Characteristics of Stressors
- Concept of Burnt Out
- General Adoption Syndrome (G.A.S.)
- Limitations of G.A.S.
- Types of Stress
- Sources of Stress
- Sources of Stress> Environmental/Situational, External
- Sources of Stress> Environmental/Situational, External
- Frustration (Physical, Social, and Internal Stressors)
- Sources of Stress> Internal Sources of Stress
- Introversion and Extroversion
- Personality Types of Variables
- Effects of Stress on Physical Health
- Cardiovascular Disorder
- Coronary Heart Disease
- Essential Hypertension
- Tension Headaches
- Asthma
- Eczema
- Peptic Ulcers
- Colitis
- Diabetes
- Effects of Stress on Performance
- Relation between Stress and Performance
- Effects of Stress on Mental Illness
- Stress Management
- Effective Ways of Handling Stress
- Stress Management Techniques
- Stress Management Techniques> Sudarshan Kriya
- Stress Management Techniques> Biofeedback
- Stress Management Techniques> Relaxation Techniques
- Ineffective Ways of Handling Stress
- Ineffective Ways of Handling Stress> Ineffective Responses
- Ineffective Ways of Handling Stress> Defence Mechanisms of the Ego
- Repression
- Regression
- Projection
- Displacement
- Reaction Formation
- Promoting Positive Health and Well-being
- Impact of Stress on Well-Being
- Effective Lifestyle
Psychological Disorders and Psychotherapy
- Concept of Abnormal Behaviour
- Perspectives of Abnormal Behaviour> Statistical Perspective
- Perspectives of Abnormal Behaviour> Biological and Medical Perspectives
- Perspectives of Abnormal Behaviour> Psychological/Psychodynamic Perspective
- Perspectives of Abnormal Behaviour> Socio-Cultural Perspective
- Perspectives of Abnormal Behaviour> Diathesis-Stress Perspective
- Features of Abnormal Behaviour
- Classification of Psychological Disorders
- DSM-IV Classification System
- DSM-IV Classification System> DSM-IV Multiaxial System
- DSM-IV Classification System> Schizophrenia Symptoms (as per DSM-IV-TR)
- Limitations of DSM-IV
- APA Criteria of Abnormal Behaviour
- DSM-V Classification
- Major Psychological Disorder> Anxiety Disorders
- Symptoms of Anxiety Disorders
- Major Psychological Disorder> Obsessive Compulsive Disorder (OCD)
- Concept of Obsession
- Compulsive Disorder
- Mood Disorders
- Depressive Disorders
- Causes of Depression
- Major Psychological Disorder> Dissociative Disorders
- Dissociative Amnesia
- Personality Disorder
- Anti-social Personality Disorder
- Avoidant Personality Disorder
- Histrionic Personality Disorder
- Dependent Personality Disorder
- Passive and Aggressive Style Personality
- Major Psychological Disorder> Eating Disorders
- Anorexia Nervosa
- Bulimia Nervosa
- Behavioural and Developmental Disorders
- External Behaviour Disorders
- Internal Behaviour Disorders
- Autism
- Major Psychological Disorder> Schizophrenia
- Symptoms of Schizophrenia> Positive Symptoms
- Symptoms of Schizophrenia> Negative Symptoms
- Types of Schizophrenia
- Origin and Causes of Schizophrenia
- Treatment and Management of Schizophrenia
- Concept of Psychotherapy
- Forms of Psychotherapy
- Psychodynamic Therapies
- Psychodynamic Therapies> Psychoanalysis
- Techniques used in Psychoanalysis
- Psychodynamic Therapies> Alfred Adler's Psychodynamic Therapy
- Psychodynamic Therapies> Sullivan's Psychodynamic Therapy
- Humanistic-existential Therapy> Client Centred Therapy
- Behaviour Therapies
- Behaviour Therapies> Systematic Desensitisation
- Behaviour Therapies> Operant-Based Behaviour Therapy
- Aversion Therapy
- Flooding or Impulsive Therapy
- Modelling
- Assertive Training
- Thought Stopping
- Token Economy
- Behaviour Therapies> Evaluation of Behaviour Therapy
- Cognitive Therapy
- Rehabilitation
Social Thought and Social Behaviour
- Social Perception
- Concept of Attribution
- Biases in Forming Attribution or Judgments
- Biases in Attribution
- Influence of Feedback on Attribution
- Sources of Biases> Cognitive Bias
- Sources of Biases> Person Positively Bias
- Sources of Biases> Motivational Bias
- Sources of Biases> Motivational Skepticism
- Sources of Biases> False Consensus Effect
- Sources of Biases> Cultural Bias
- Sources of Biases> Hostile Attribution Bias
- Sources of Biases> Intergroup Attribution Bias
- Criticisms of Attribution Bias
- Reduction of Attribution Bias
- Social Groups
- Characteristics of Social Group
- Types of Social Group
- Formation of Groups
- Ingredients of Group Behaviour
- Functions of Group
- Group At Work
- Influence of Group on Individual Behaviour
- Changing Others’ Behaviour
- Reasons for Influencing Behaviour
- Techniques of Behaviour Change
- Concept of Social Norms
- Concept of Conformity
- Value of Conformity
- Conformity to Social Norms
- Asch's Study on Conformity
- Concept of Obedience
- Causes of Obedience
- Milgram's Experiment on Obedience
- Difference between Conformity and Obedience
- Factors Affecting Conformity and Obedience
Attitudes, Prejudice and Stereotypes
- Concept of Attitude
- Earlier Studies on Attitude
- Nature and Components of Attitudes
- Classification of Attitude
- Formation of Attitude
- Role of Genetic Factors in Attitude Formation
- Determinants of Attitude
- Motivational Determinants
- Perceptual Determinants
- Social Determinants
- Verbal Determinant
- Personality Factors
- Functions of Attitude
- Attitude and Related Concepts
- Attitude Change
- Social Groups
- Compliance
- Identification
- Internalization through Persuasion
- Direct Contact
- Increased Familiarity of the Attitudinal Object
- Education
- Frame of Reference
- Sudden Conversion due to Trauma
- Role Playing and Dramatic Experience
- Cognitive Dissonance
- Balance of the Psychological Field
- Programme of Action for Attitude Change
- Indian Research on Attitude and Change
- Prejudice and Discrimination
- Concept of Prejudice
- Origin and Development of Prejudice
- Gender Prejudice
- Causes of Prejudice
- Personality and Motivational Determinants
- Cultural Determinants
- Indian Studies on Social Prejudice
- Studies on Caste Prejudice
- Reducing and Resisting Prejudice and Discrimination
- Cognitive Approaches
- Educational Approaches
- Concept of Stereotypes
- Types of Stereotypes
- Caste Stereotypes
- Gender Stereotypes
- Community Stereotypes
- Change of Stereotypes
- Studies on Stereotypes
Applications of Psychology to Different Areas of Life
- Applications of Psychology
- Applications of Psychology > Clinical and Counselling Psychology
- Components of Counselling Process
- Areas of Counselling
- Application of Psychological Tests in Counselling
- Stages of Counselling Process
- Counselling and Psycho-Analysis
- Counselling and Anti-social Behaviour
- Case Studies Using Counselling Process
- Types of Counselling
- Counselling and Therapy
- Advantages of Counselling
- Ethics in Counselling
- Role of Counsellor
- Role of a Counsellor with Individuals, Couples and Families
- Role of a Counsellor with Couples
- Role of Counsellor in Family Issues
- Role of Counsellor with Group Problems
- Applications of Psychology > School and Educational Area
- Facilitation of Learning in School
- Effective Motivation for Study
- Stimulating School Environment
- Making the Study Material Meaningful
- Teacher–Student Relationship
- Difficulties of Teachers and Students
- Teaching and Evaluation Techniques
- Objective Type of Examination
- Role of School Psychologist
- Improvement of Memory of Students
- Method of LOCI
- Numerical Pegs
- Chunking
- Narrative Stories
- Individual Differences and Career Planning
- Career Counselling
- Role of Psychologist in Career Selection
- Requirements of a Job
- Job Analysis
- Testing Individuals
- Matching Individuals with Jobs
- Determinants of Judicious Choice of Career
- Career Information
- Aligning Career with Aptitude & Interest
- Don't Pursue a Job Due to Pressure
- Develop Insight into Self
- Opportunities, Hobbies, and Interests
- Applications of Psychology > Organisational Area
- Personnel Psychology
- Selection and Recruitment
- Training
- Scientific Management
- Planning and Time and Motion Study
- Time Study
- Motion Study
- Scientific Management
- Role of Social Industrial Psychology and Attitude
- Motivation, Incentives, Job Satisfaction and Work Environment
- Leadership Skills and Team Building
- Marketing and Consumer Behaviour
- Personal Consumer and Organizational Consumer
- Personality Factors of Consumers
- Self Image and Multiple Selves
- Role of Culture on Consumer Psychology
- Cross-Cultural Consumer Analysis
- Consumer's Decision-Making Process
- Application of Psychology to Crime and Criminals
- Increase in Crime
- Causes of Criminal Behaviour
- Psychological Causes of Crime
- Prevention of Criminals
- Probation System
- Control of Criminals
- Rehabilitation of Criminals
Estimated time: 8 minutes
- Introduction
- Core Concept
- I.Q. Distribution
- Real-Life Application
- Key Points: Distribution of I.Q.s in the Population
CISCE: Class 12
Introduction
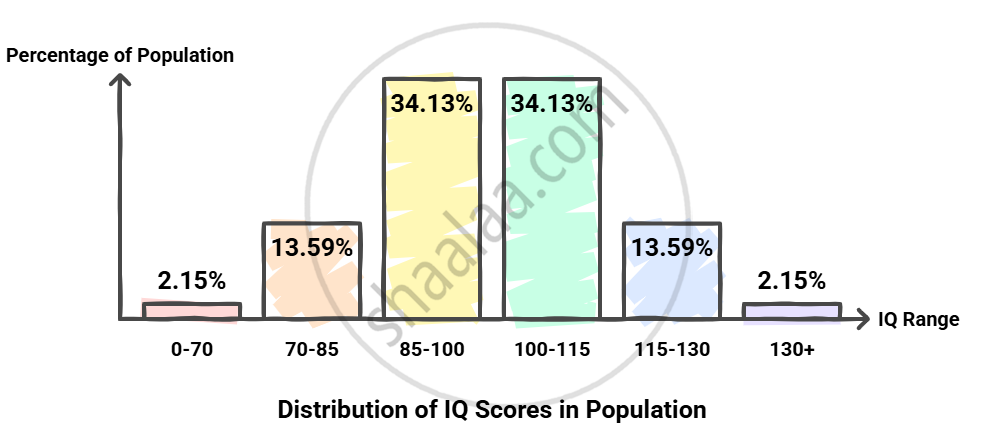
When intelligence tests are administered to thousands of people, the scores reveal a pattern known as a “bell curve” or normal distribution. Most people score near the average, while very few have very high or very low scores.
CISCE: Class 12
Core Concept
- I.Q. (Intelligence Quotient) indicates cognitive ability compared to the overall average.
- The average I.Q. is set at 100.
- Most people score in the middle, with fewer at the extremes.
CISCE: Class 12
I.Q. Distribution
CISCE: Class 12
Real-Life Application
Imagine 100 students in a school:
- Approximately 68 individuals will have IQs between 85 and 115 (average).
- Only 2 or 3 will score lower than 70 or above 130.
CISCE: Class 12
Key Points: Distribution of I.Q.s in the Population
- IQ scores follow a normal distribution (bell curve) when tested on a large number of people.
- The average IQ is 100, and most people score close to this average.
- About 68% of people score between IQ 85 and 115, which is the average range.
- Very few people score at the extremes (below 70 or above 130).
- In the graph, the X-axis shows IQ scores and the Y-axis shows the percentage of people in each IQ category.
