Topics
Units and Measurements
- Quantitative Science
- System of Units
- Derived Quantities and Units
- Rules and Conventions for Writing SI Units and Their Symbols
- Measurement of Length
- Measurement of Mass
- Measurement of Time
- Dimensions and Dimensional Analysis
- Accuracy, Precision and Uncertainty in Measurement
- Errors in Measurements>Systematic Errors
- Errors in Measurements>Random Errors
- Estimation of Errors
- Combination of Errors
- Significant Figures
- Definitions of SI Units and Constants
Mathematical Methods
- Vector Analysis
- Scalar
- Vector
- Vector Operations>Multiplication of a Vector by a Scalar
- Vector Operations>Addition and Subtraction of Vectors
- Vector Operations>Triangle Law for Vector Addition
- Vector Operations>Law of parallelogram of vectors
- Resolution of Vectors
- Multiplication of Vectors>Scalar Product(Dot Product)
- Multiplication of Vectors>Vector Product (Cross Product)
- Concept of Calculus
- Differential Calculus
- Integral Calculus
Motion in a Plane
- Concept of Motion
- Rectilinear Motion
- Displacement
- Path Length
- Average Velocity
- Average Speed
- Instantaneous Velocity
- Instantaneous Speed
- Acceleration in Linear Motion
- Relative Velocity
- Motion in Two Dimensions - Motion in a Plane
- Average and Instantaneous Velocities
- Acceleration in a Plane
- Equations of Motion in a Plane with Constant Acceleration
- Relative Velocity in Two Dimensions
- Projectile Motion
- Uniform Circular Motion (UCM)
- Key Parameters of Circular Motion
- Centripetal Acceleration
- Conical Pendulum
Laws of Motion
- Fundamental Principles of Motion and Mechanics
- Types of Motion
- Aristotle’s Fallacy
- Newton’s Laws of Motion
- Newton's First Law of Motion
- Newton’s Second Law of Motion
- Newton's Third Law of Motion
- Inertial and Non-inertial Frames of Reference
- Types of Forces>Fundamental Forces in Nature
- Types of Forces>Contact and Non-Contact Forces
- Types of Forces>Real and Pseudo Forces
- Types of Forces>Conservative and Non-Conservative Forces
- Types of Forces>Work Done by a Variable Force
- Work Energy Theorem
- Principle of Conservation of Linear Momentum
- Collisions
- Elastic and Inelastic Collisions
- Perfectly Inelastic Collision
- Coefficient of Restitution e
- Expressions for Final Velocities in Elastic Head-On Collision
- Loss of Kinetic Energy in Perfectly Inelastic Head-On Collision
- Collision in Two Dimensions
- Impulse of a Force
- Necessity of Defining Impulse
- Rotational Analogue of a Force: Moment of a Force Or Torque
- Couple and Its Torque
- Proof of Independence of the Axis of Rotation
- Mechanical Equilibrium
- States of Equilibrium
- Centre of Mass>Mathematical Understanding of Centre of Mass
- Centre of Mass>Velocity of Centre of Mass
- Centre of Mass>Acceleration of Centre of Mass
- Centre of Mass>Characteristics of Centre of Mass
- Centre of Gravity
Gravitation
- Concept of Gravitation
- Kepler’s Laws
- Law of Orbit or Kepler's First Law
- Law of Areas or Kepler's Second Law
- Law of Periods or Kepler's Third Law
- Newton's Universal Law of Gravitation
- Measurement of the Gravitational Constant (G)
- Acceleration Due to Gravity (Earth’s Gravitational Acceleration)
- Variation in the Acceleration>Variation in Gravity with Altitude
- Variation in the Acceleration>Variation in Gravity with Depth
- Variation in the Acceleration>Variation in Gravity with Latitude and Rotation of the Earth
- Variation in the Acceleration>Effect of the Shape of the Earth
- Gravitational Potential Energy
- Expression for Gravitational Potential Energy
- Connection of Potential Energy Formula with mgh
- Potential Difference
- Escape Velocity
- Earth Satellites
- Projection of Satellite
- Weightlessness in a Satellite
- Time Period of Satellite
- Binding Energy of an Orbiting Satellite
Mechanical Properties of Solids
- Understanding Mechanical Properties of Solids
- Elastic Behavior of Solids
- Stress and Strain
- Types of Stress and Corresponding Strain
- Hooke’s Law
- Elastic Modulus>Young’s Modulus
- Elastic Modulus>Bulk Modulus
- Elastic Modulus>Shear Modulus (Modulus of Rigidity)
- Elastic Modulus>Poisson’s Ratio
- Stress-strain Curve
- Strain Energy
- Hardness of Material
- Friction in Solids
- Origin of Friction
- Types of Friction>Static Friction
- Types of Friction>Kinetic Friction
- Types of Friction>Rolling Friction
Thermal Properties of Matter
- Understanding Thermal Properties of Matter
- Temperature and Heat
- Measurement of Temperature
- Absolute Zero and Absolute Temperature
- Ideal Gas Equation
- Thermal Expansion
- Linear Expansion
- Areal Expansion
- Volume Expansion
- Specific Heat Capacity of Solids and Liquids
- Relation Between Coefficient of Expansion
- Specific Heat Capacity of Gas
- Heat Equation
- Thermal Capacity
- Calorimetry
- Change of State
- Analysis of Observation>From Point A to B
- Analysis of Observation>From Point B to D
- Evaporation vs Boiling
- Boiling Point and Pressure
- Sublimation
- Phase Diagram
- Gas and Vapour
- Latent Heat
- Heat Transfer
- Conduction
- Thermal Conductivity
- Coefficient of Thermal Conductivity
- Thermal Resistance
- Applications of Thermal conductivity
- Convection
- Application of Convection
- Free and Forced Convection
- Radiation
- Newton’s Law of Cooling
Sound
- Sound Waves
- Common Properties of All Waves
- Transverse Waves
- Longitudinal Waves
- Mathematical Expression of a Wave
- The Speed of Travelling Waves
- The Speed of Transverse Waves
- The Speed of Longitudinal Waves
- Newton's Formula for Velocity of Sound
- Laplace’s Correction
- Factors Affecting Speed of Sound
- Principle of Superposition of Waves
- Echo
- Reverberation
- Acoustics
- Qualities of Sound
- Doppler Effect
- Source Moving and Listener Stationary
- Listener Approaching a Stationary Source with Velocity
- Both Source and Listener are Moving
- Common Properties between Doppler Effect of Sound and Light
- Major Differences between Doppler Effects of Sound and Light
Optics
- Fundamental Concepts of Light
- Nature of Light
- Ray Optics Or Geometrical Optics
- Cartesian Sign Convention
- Reflection>Reflection from a Plane Surface
- Reflection>Reflection from Curved Mirrors
- Total Internal Reflection
- Refraction of Light
- Applications of Total Internal Reflection
- Refraction at a Spherical Surface and Lenses
- Thin Lenses and Their Combination
- Refraction at a Single Spherical Surface
- Lens Makers' Equation
- Dispersion of Light
- Analysis of Prism
- Thin Prisms
- Some Natural Phenomena Due to Sunlight
- Defects of Lenses
- Introduction to Optical Instruments
- Simple Microscope or a Reading Glass
- Compound Microscope
- Telescope
Electrostatics
- Concept of Electrostatics
- Electric Charge
- Properties of Electric Charge
- Additive Nature of Charge
- Quantization of Charge
- Conservation of Charge
- Force between Charges
- Coulomb’s Law
- Coulomb's Law (Scalar Form): Force Between Two Point-Charges
- Relative Permittivity or Dielectric Constant
- Definition of Unit Charge from the Coulomb’s Law
- Coulomb's Law in Vector Form
- Forces Between Multiple Charges: Superposition Principle
- Electric Field
- Electric Field Intensity Due to a Point-Charge
- Practical Way of Calculating Electric Field
- Electric Lines of Force
- Electric Flux
- Gauss’s Law
- Electric Dipole
- Couple Acting on an Electric Dipole in a Uniform Electric Field
- Electric Intensity at a Point Due to an Electric Dipole
- Continuous Charge Distribution
Electric Current Through Conductors
- Electric Current and Its Related Concepts
- Electric Current
- Flow of Current Through a Conductor
- Drift Speed
- Ohm's Law
- Limitations of Ohm’s Law
- Electrical Power
- Resistors
- Rheostat
- Resistors in Parallel
- Specific Resistance or Electrical Resistivity
- Variation of Resistance with Temperature
- Electromotive Force of a Cell
- Cells in Series
- Cells in Parallel
- Types of Cells
Magnetism
- Concept of Magnetism
- Magnetic Lines of Force
- Bar Magnet and Solenoid Analogy
- Magnetic Field due to a Bar Magnet
- Magnetic Field Due to a Bar Magnet at an Arbitrary Point
- Gauss' Law of Magnetism
- The Earth’s Magnetism
Electromagnetic Waves and Communication System
- Foundations of Electromagnetic Theory
- Electromagnetic Waves
- Characteristics of EM Waves
- Electromagnetic Spectrum
- Radio Waves
- Microwaves
- Infrared waves
- Visible Light
- Ultraviolet rays
- X-rays
- Gamma Rays
- Propagation of EM Waves
- Ground (surface) Wave
- Space wave
- Sky wave propagation
- Communication System
- Elements of a Communication System
- Commonly Used Terms in Electronic Communication System
- Modulation
Semiconductors
- Concept of Semiconductors
- Electrical Conduction in Solids
- Band Theory of Solids
- Intrinsic Semiconductor
- Extrinsic Semiconductor
- n-type Semiconductor
- p-type Semiconductor
- Charge neutrality of extrinsic semiconductors
- Diode or p-n Junction
- Basics of Semiconductor Devices
- Applications of Semiconductors and P-n Junction Diode
- Thermistor
Introduction
A phase diagram (also called a P–T diagram) is a graph of Pressure (P) on the Y-axis versus Temperature (T) on the X-axis. It is one of the most powerful tools in physics and chemistry — it tells you, at any given combination of temperature and pressure, whether a substance will be a solid, liquid, or gas. The diagram is divided into three regions by three boundary curves, and all three curves meet at a single unique point called the triple point.
A phase is a homogeneous, uniform portion of matter with consistent composition and physical properties throughout. The same substance can exist in different phases.
Definition: Triple Point
The temperature and pressure at which all three phases of a substance coexist is called the triple point of a substance.
Vaporisation Curve (l–v)
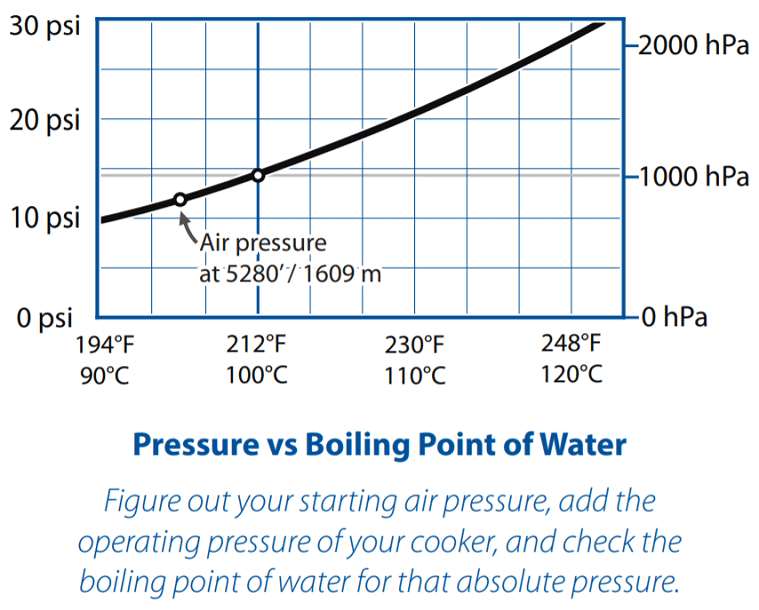
The vaporisation curve is a graph of boiling point vs. pressure. Every point on this curve is a state where liquid water and water vapour coexist in equilibrium.
Key Facts:
- At 1 atm pressure, water boils at exactly 100°C
- As pressure decreases, the boiling point also decreases
- As pressure increases, the boiling point also increases
Fusion Curve (l–s)
The fusion curve is a graph of the melting (freezing) point vs pressure. Points on this curve represent states where ice and liquid water coexist in equilibrium.
Key Facts:
- At 1 atm, the freezing point of water is 0°C
- Between 0°C and 100°C at 1 atm, water exists only as liquid
- Below 0°C → solid (ice); above 100°C → vapour (steam) at 1 atm
Special Property: Negative Slope of Water's Fusion Curve
For most substances (e.g., CO₂), the fusion curve has a positive slope — increasing pressure raises the melting point.
For water, the fusion curve has a negative slope — increasing pressure slightly lowers the melting point. This occurs because:
- Water expands when it freezes (ice is less dense than liquid water — an anomalous property)
- Applying pressure favours the denser phase (liquid), so ice tends to melt under high pressure
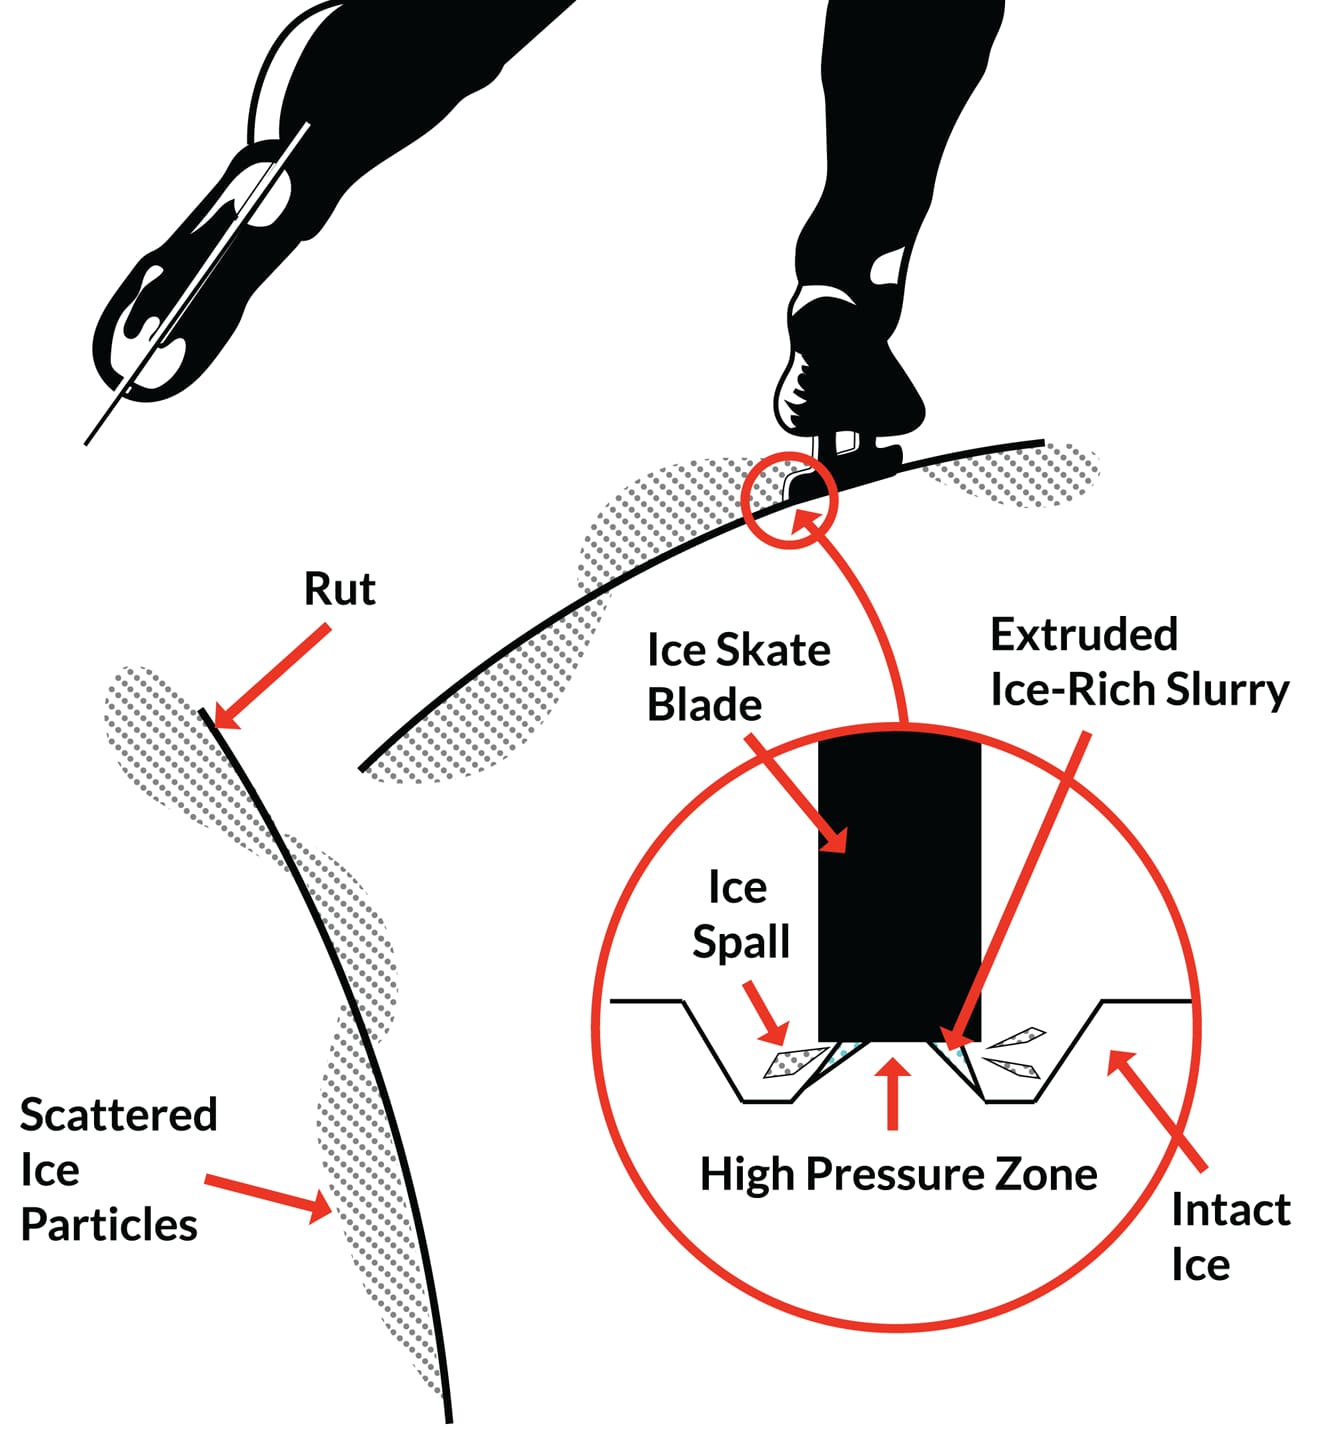
Diagram of an ice skate blade creating a high-pressure zone and an ice-rich slurry for low friction
Sublimation Curve (s–v)
The sublimation curve is a graph of the sublimation point vs pressure. Points on this curve represent states where ice and water vapour coexist directly — the substance transitions from solid to gas without passing through the liquid phase.
Key Facts for Water:
- Water sublimates only at pressures less than 0.006 atm (below its triple point pressure)
- At pressures above 0.006 atm, water cannot sublimate directly
The Triple Point
The triple point is the unique temperature and pressure at which all three phases of a substance — solid, liquid, and vapour — coexist in equilibrium simultaneously.
- It is where all three curves (l–v, l–s, s–v) meet on the phase diagram
- It exists at only one specific temperature and one specific pressure for each substance
- At any other condition, at most two phases can coexist
Real-Life Examples
| Concept | Real-Life Example | What It Shows |
|---|---|---|
| Vaporisation curve | Pressure cooker | The boiling point rises with pressure |
| Fusion curve (negative slope) | Ice skating | Pressure lowers the melting point of ice |
| Sublimation curve | Dry ice at concerts | CO₂ solid → gas at 1 atm, –78°C |
| Triple point | Laboratory demonstration | All three phases coexist at unique T & P |
Key Points: Phase Diagram
- A phase diagram maps all phases of a substance against pressure and temperature
- Three curves — vaporisation (l–v), fusion (l–s), and sublimation (s–v) — divide the diagram into solid, liquid, and vapour regions
- Water's fusion curve has a negative slope because water expands on freezing — this is an anomalous property
- CO₂'s fusion curve has a positive slope — normal behaviour for most substances
- The triple point is the only condition at which all three phases coexist; for water, it is 273.16 K and 6.11 × 10⁻³ Pa
