Topics
Fractions in Disguise
A Square and A Cube
Part 1
Rational Numbers
- Rational Numbers
- Closure Property of Rational Numbers
- Commutative Property of Rational Numbers
- Associative Property of Rational Numbers
- Distributive Property of Multiplication Over Addition for Rational Numbers
- Identity of Addition and Multiplication of Rational Numbers
- Negative Or Additive Inverse of Rational Numbers
- Concept of Reciprocals or Multiplicative Inverses
- Rational Numbers on a Number Line
- Rational Numbers Between Two Rational Numbers
- Multiples and Common Multiples
Part 2
The Baudhayana-Pythagoras Theorem
Power Play
Linear Equations in One Variable
- Constants and Variables in Mathematics
- Equation in Mathematics
- Expressions with Variables
- Word Problems on Linear Equations
- Solving Equations Which Have Linear Expressions on One Side and Numbers on the Other Side
- Some Applications Solving Equations Which Have Linear Expressions on One Side and Numbers on the Other Side
- Solving Equations Having the Variable on Both Sides
- Some More Applications on the Basis of Solving Equations Having the Variable on Both Sides
- Reducing Equations to Simpler Form
- Equations Reducible to Linear Equations
Proportional Reasoning-2
A Story of Numbers
Understanding Quadrilaterals
- Concept of Curves
- Different Types of Curves - Closed Curve, Open Curve, Simple Curve.
- Basic Concept of Polygons
- Classification of Polygons
- Properties of Quadrilateral
- Sum of Interior Angles of a Polygon
- Sum of Exterior Angles of a Polygon
- Quadrilaterals
- Properties of Trapezium
- Properties of Kite
- Properties of a Parallelogram
- Properties of Rhombus
- Property: The Opposite Sides of a Parallelogram Are of Equal Length.
- Property: The Opposite Angles of a Parallelogram Are of Equal Measure.
- Property: The adjacent angles in a parallelogram are supplementary.
- Property: The diagonals of a parallelogram bisect each other. (at the point of their intersection)
- Property: The diagonals of a rhombus are perpendicular bisectors of one another.
- Property: The Diagonals of a Rectangle Are of Equal Length.
- Properties of Rectangle
- Properties of a Square
- Property: The diagonals of a square are perpendicular bisectors of each other.
Practical Geometry
- Geometric Tool
- Constructing a Quadrilateral When the Lengths of Four Sides and a Diagonal Are Given
- Constructing a Quadrilateral When Two Diagonals and Three Sides Are Given
- Constructing a Quadrilateral When Two Adjacent Sides and Three Angles Are Known
- Constructing a Quadrilateral When Three Sides and Two Included Angles Are Given
- Some Special Cases
Exploring Some Geometric Themes
Quadrilaterals
Data Handling
Squares and Square Roots
- Concept of Square Number
- Properties of Square Numbers
- Some More Interesting Patterns of Square Number
- Finding the Square of a Number
- Concept of Square Roots
- Finding Square Root Through Repeated Subtraction
- Finding Square Root Through Prime Factorisation
- Finding Square Root by Division Method
- Square Root of Decimal Numbers
- Estimating Square Root
Tales by Dots and Lines
Number Play
Cubes and Cube Roots
We Distribute, Yet Things Multiply
Algebra Play
Area
Proportional Reasoning-1
Comparing Quantities
- Ratio
- Increase Or Decrease as Percent
- Concept of Discount
- Estimation in Percentages
- Basic Concepts of Profit and Loss
- Calculation of Interest
- Concept of Compound Interest
- Deducing a Formula for Compound Interest
- Rate Compounded Annually Or Half Yearly (Semi Annually)
- Applications of Compound Interest Formula
Algebraic Expressions and Identities
- Algebraic Expressions
- Terms, Factors and Coefficients of Expression
- Classification of Terms in Algebra
- Addition of Algebraic Expressions
- Subtraction of Algebraic Expressions
- Multiplication of Algebraic Expressions
- Multiplying Monomial by Monomials
- Multiplying a Monomial by a Binomial
- Multiplying a Monomial by a Trinomial
- Multiplying a Binomial by a Binomial
- Multiplying a Binomial by a Trinomial
- Concept of Identity
- Expansion of (a + b)2 = a2 + 2ab + b2
- Expansion of (a - b)2 = a2 - 2ab + b2
- Expansion of (a + b)(a - b) = a2-b2
- Expansion of (x + a)(x + b)
Mensuration
Exponents and Powers
Visualizing Solid Shapes
Direct and Inverse Proportions
Factorization
- Factors and Common Factors
- Factorising Algebraic Expressions
- Factorisation by Taking Out Common Factors
- Factorisation by Regrouping Terms
- Factorisation Using Identities
- Factors of the Form (x + a)(x + b)
- Dividing a Monomial by a Monomial
- Dividing a Polynomial by a Monomial
- Dividing a Polynomial by a Polynomial
- Concept of Find the Error
Introduction to Graphs
Playing with Numbers
- Definition: Graph
- Graph Paper
- X-axis and Y-axis
- Use of Scale
Definition
A Pictograph is a chart that uses pictures or symbols to represent data. Each picture stands for a specific number of items, making the data easy to understand at a glance.
Graph Paper
Structure of Graph Paper:
1. Grid Formation:
Graph paper consists of a network of bold and faint lines.
The bold lines represent larger units, while the faint lines divide these units into smaller, equal parts.
2. Purpose of the Grid:
This structure helps in choosing a suitable scale.
It also assists in drawing accurate columns or bars based on data values.
3. Axes on Graph Paper:
A horizontal line is drawn near the bottom edge of the paper, known as the X-axis.
On the left side, draw a vertical line perpendicular to the X-axis, which we call the Y-axis. Example:
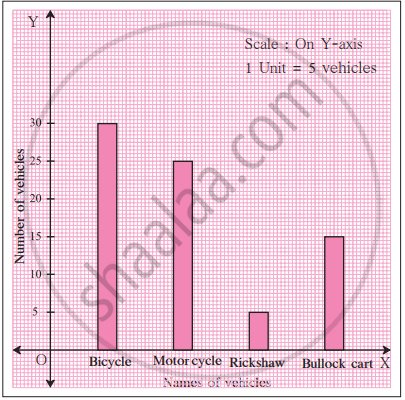
The following information is to be represented as a bar graph: The number of different types of vehicles is: 5, 15, 25, and 30. Use the X-axis to represent the types of vehicles. Use the Y-axis to represent the number of vehicles. Take a scale of 5 vehicles = 1 big unit.
Shaalaa.com | Selecting Right Scale
Series: Concept of Bar Graph
Related QuestionsVIEW ALL [61]
The following table shows the number of Buses and Trucks in nearest lakh units. Draw percentage bar-diagram. (Approximate the percentages to the nearest integer)
| Year | No. of Trucks | No. of Buses |
| 2005-2006 | 47 | 9 |
| 2007-2008 | 56 | 13 |
| 2008-2009 | 60 | 16 |
| 2009-2010 | 63 | 18 |

The performance of students in 1st Term and 2nd Term is given. Draw a double bar graph choosing appropriate scale and answer the following:
| Subject | English | Hindi | Maths | Science | S. science |
| 1st Term (M.M. 100) | 67 | 72 | 88 | 81 | 73 |
| 2nd Term (M.M. 100) | 70 | 65 | 95 | 85 | 75 |
- In which subject, has the child improved his performance the most?
- In which subject is the improvement the least?
- Has the performance gone down in any subject?
Number of children in six different classes are given below. Represent the data on a bar graph.
| Class | Fifth | Sixth | Seventh | Eighth | Ninth | Tenth |
| Number of children | 135 | 120 | 95 | 100 | 90 | 80 |
- How would you choose a scale?
- Answer the following questions:
- Which class has the maximum number of children? And the minimum?
- Find the ratio of students of class sixth to the students of class eight.
Prepare a bar graph of the data given in the question.
| Surname | Number of people |
| Khan |  |
| Patel |  |
| Rao |  |
| Roy |  |
| Saikia |  |
| Singh |  |


The following table shows the number of Buses and Trucks in nearest lakh units. Draw percentage bar-diagram. (Approximate the percentages to the nearest integer)
| Year | No. of Trucks | No. of Buses |
| 2006-2007 | 47 | 9 |
| 2007-2008 | 56 | 13 |
| 2008-2009 | 60 | 16 |
| 2009-2010 | 63 | 18 |
