Topics
Fractions in Disguise
A Square and A Cube
Part 1
Rational Numbers
- Rational Numbers
- Closure Property of Rational Numbers
- Commutative Property of Rational Numbers
- Associative Property of Rational Numbers
- Distributive Property of Multiplication Over Addition for Rational Numbers
- Identity of Addition and Multiplication of Rational Numbers
- Negative Or Additive Inverse of Rational Numbers
- Concept of Reciprocals or Multiplicative Inverses
- Rational Numbers on a Number Line
- Rational Numbers Between Two Rational Numbers
- Multiples and Common Multiples
Part 2
Power Play
The Baudhayana-Pythagoras Theorem
Linear Equations in One Variable
- Constants and Variables in Mathematics
- Equation in Mathematics
- Expressions with Variables
- Word Problems on Linear Equations
- Solving Equations Which Have Linear Expressions on One Side and Numbers on the Other Side
- Some Applications Solving Equations Which Have Linear Expressions on One Side and Numbers on the Other Side
- Solving Equations Having the Variable on Both Sides
- Some More Applications on the Basis of Solving Equations Having the Variable on Both Sides
- Reducing Equations to Simpler Form
- Equations Reducible to Linear Equations
Understanding Quadrilaterals
- Concept of Curves
- Different Types of Curves - Closed Curve, Open Curve, Simple Curve.
- Basic Concept of Polygons
- Classification of Polygons
- Properties of Quadrilateral
- Sum of Interior Angles of a Polygon
- Sum of Exterior Angles of a Polygon
- Quadrilaterals
- Properties of Trapezium
- Properties of Kite
- Properties of a Parallelogram
- Properties of Rhombus
- Property: The Opposite Sides of a Parallelogram Are of Equal Length.
- Property: The Opposite Angles of a Parallelogram Are of Equal Measure.
- Property: The adjacent angles in a parallelogram are supplementary.
- Property: The diagonals of a parallelogram bisect each other. (at the point of their intersection)
- Property: The diagonals of a rhombus are perpendicular bisectors of one another.
- Property: The Diagonals of a Rectangle Are of Equal Length.
- Properties of Rectangle
- Properties of a Square
- Property: The diagonals of a square are perpendicular bisectors of each other.
Proportional Reasoning-2
A Story of Numbers
Practical Geometry
- Geometric Tool
- Constructing a Quadrilateral When the Lengths of Four Sides and a Diagonal Are Given
- Constructing a Quadrilateral When Two Diagonals and Three Sides Are Given
- Constructing a Quadrilateral When Two Adjacent Sides and Three Angles Are Known
- Constructing a Quadrilateral When Three Sides and Two Included Angles Are Given
- Some Special Cases
Quadrilaterals
Exploring Some Geometric Themes
Data Handling
Tales by Dots and Lines
Number Play
Squares and Square Roots
- Concept of Square Number
- Properties of Square Numbers
- Some More Interesting Patterns of Square Number
- Finding the Square of a Number
- Concept of Square Roots
- Finding Square Root Through Repeated Subtraction
- Finding Square Root Through Prime Factorisation
- Finding Square Root by Division Method
- Square Root of Decimal Numbers
- Estimating Square Root
Cubes and Cube Roots
We Distribute, Yet Things Multiply
Algebra Play
Area
Proportional Reasoning-1
Comparing Quantities
- Ratio
- Increase Or Decrease as Percent
- Concept of Discount
- Estimation in Percentages
- Basic Concepts of Profit and Loss
- Calculation of Interest
- Concept of Compound Interest
- Deducing a Formula for Compound Interest
- Rate Compounded Annually Or Half Yearly (Semi Annually)
- Applications of Compound Interest Formula
Algebraic Expressions and Identities
- Algebraic Expressions
- Terms, Factors and Coefficients of Expression
- Classification of Terms in Algebra
- Addition of Algebraic Expressions
- Subtraction of Algebraic Expressions
- Multiplication of Algebraic Expressions
- Multiplying Monomial by Monomials
- Multiplying a Monomial by a Binomial
- Multiplying a Monomial by a Trinomial
- Multiplying a Binomial by a Binomial
- Multiplying a Binomial by a Trinomial
- Concept of Identity
- Expansion of (a + b)2 = a2 + 2ab + b2
- Expansion of (a - b)2 = a2 - 2ab + b2
- Expansion of (a + b)(a - b) = a2-b2
- Expansion of (x + a)(x + b)
Mensuration
Exponents and Powers
Visualizing Solid Shapes
Direct and Inverse Proportions
Factorization
- Factors and Common Factors
- Factorising Algebraic Expressions
- Factorisation by Taking Out Common Factors
- Factorisation by Regrouping Terms
- Factorisation Using Identities
- Factors of the Form (x + a)(x + b)
- Dividing a Monomial by a Monomial
- Dividing a Polynomial by a Monomial
- Dividing a Polynomial by a Polynomial
- Concept of Find the Error
Introduction to Graphs
Playing with Numbers
- Definition: Graph
- Graph Paper
- X-axis and Y-axis
- Use of Scale
Definition
A Pictograph is a chart that uses pictures or symbols to represent data. Each picture stands for a specific number of items, making the data easy to understand at a glance.
Graph Paper
Structure of Graph Paper:
1. Grid Formation:
Graph paper consists of a network of bold and faint lines.
The bold lines represent larger units, while the faint lines divide these units into smaller, equal parts.
2. Purpose of the Grid:
This structure helps in choosing a suitable scale.
It also assists in drawing accurate columns or bars based on data values.
3. Axes on Graph Paper:
A horizontal line is drawn near the bottom edge of the paper, known as the X-axis.
On the left side, draw a vertical line perpendicular to the X-axis, which we call the Y-axis.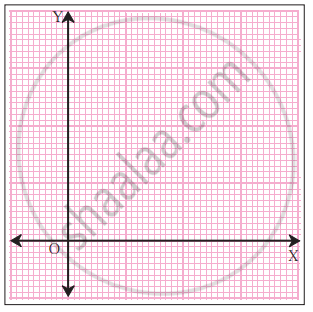 Example:
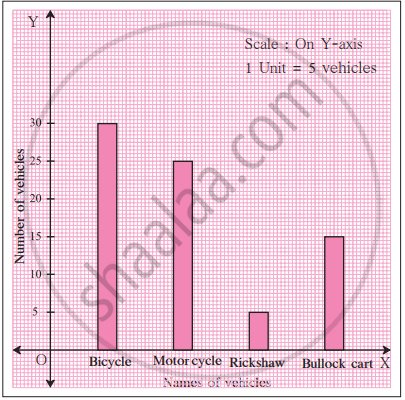
The following information is to be represented as a bar graph: The number of different types of vehicles is: 5, 15, 25, and 30. Use the X-axis to represent the types of vehicles. Use the Y-axis to represent the number of vehicles. Take a scale of 5 vehicles = 1 big unit.
Shaalaa.com | Selecting Right Scale
Series: Concept of Bar Graph
Related QuestionsVIEW ALL [61]

Prepare a bar graph of the data given in the question.
| Surname | Number of people |
| Khan |  |
| Patel |  |
| Rao |  |
| Roy |  |
| Saikia |  |
| Singh |  |

Observe the following data:
| Government School, Chandpur | ||
| Daily Attendance | Date: 15.4.2009 | |
| Class | Total Students | Number of Students Present on that Day |
| VI | 90 | 81 |
| VII | 82 | 76 |
| VIII | 95 | 91 |
| IX | 70 | 65 |
| X | 63 | 62 |
- Draw a double bar graph choosing an appropriate scale. What do you infer from the bar graph?
- Which class has the maximum number of students?
- In which class, the difference of total students and number of students present is minimum?
- Find the ratio of number of students present to the total number of students of Class IX.
- What per cent of Class VI students were absent?
The lengths in km (rounded to nearest hundred) of some major rivers of India is given below:
| River | Length (in km) |
| Narmada | 1300 |
| Mahanadi | 900 |
| Brahmputra | 2900 |
| Ganga | 2500 |
| Kaveri | 800 |
| Krishna | 1300 |
Draw a bar graph to represent the above information.
The following table shows the average intake of nutrients in calories by rural and urban groups in a particular year. Using a suitable scale for the given data, draw a double bar graph to compare the data.
| Foodstuff | Rural | Urban |
| Pulses | 35 | 49 |
| Leafy vegetables | 14 | 21 |
| Other vegetables | 51 | 89 |
| Fruits | 35 | 66 |
| Milk | 70 | 250 |
| Fish and flesh floods | 10 | 22 |
| Fats and Oils | 9 | 35 |
| Sugar/Jaggery | 19 | 31 |
The table below gives the flavours of ice cream liked by children (boys and girls) of a society.
| Flavours | Vanilla | Chocolate | Strawberry | Mango | Butterscotch |
| Boys | 4 | 9 | 3 | 8 | 13 |
| Girls | 8 | 12 | 7 | 9 | 10 |
Study the table and answer the following questions:
- Draw a double bar graph using appropriate scale to represent the above information.
- Which flavour is liked the most by the boys?
- How many girls are there in all?
- How many children like chocolate flavour of ice cream?
- Find the ratio of children who like strawberry flavour to vanilla flavour of ice cream.
