Topics
Linear Equations in Two Variables
Quadratic Equations
- Quadratic Equations
- Factorisation Method
- Completing the Square Method
- Quadratic Formula (Shreedharacharya's Rule)
- Nature of Roots of a Quadratic Equation
- Relation Between Zeroes (Roots) and Coefficients of a Quadratic Equation
- Formation of a Quadratic Equation with Given Roots
- Application of Quadratic Equation
Arithmetic Progression
Financial Planning
- Mathematical Study of GST (Goods and Services Tax)
- GST Structure for Calculations
- Tax Invoice Under GST(Mathematics)
- GST in Trading Chain
- Input Tax Credit (ITC) in Mathematics
- Computational Mechanisms under GST
- Saving and Investment
- Shares
- Brokerage and Taxes on Share Trading
- Mutual Funds and Systematic Investment Plan
Probability
Statistics
Maharashtra State Board: Class 10
Formula: Central Angle
\[\text{Central angle}=\frac{\text{Value of component}}{\text{Total value}}\times360^\circ\]
Maharashtra State Board: Class 10
Key Points: Pie Diagram
-
A pie diagram represents data using a circle.
-
The whole circle = total data = 360°.
-
Each part of the data is shown by a sector.
-
The central angle of a sector is proportional to the data value.
- Larger value → larger sector, smaller value → smaller sector.
Example
On a particular day, the sales (in rupees) of different items of a baker’s shop are given below.
| ordinary bread | 320 |
| fruit bread | 80 |
| cakes and pastries | 160 |
| biscuits | 120 |
| others | 40 |
|
Total
|
720 |
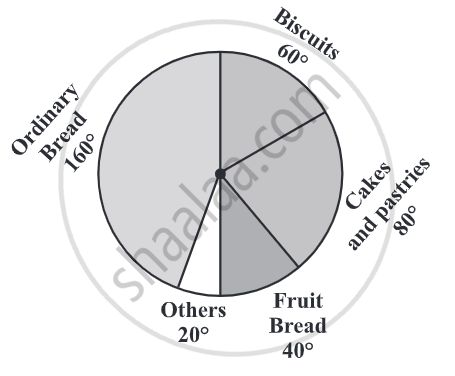
Draw a pie chart for this data.
We find the central angle of each sector. Here the total sale = Rs. 720. We thus have this table.
| Item | Sales (In Rs.) | In Fraction | Central Angle |
| Ordinary Bread | 320 | `320/720 = 4/9` | `4/9xx360° = 160°` |
| Fruit Bread | 80 | `80/720 = 1/9` | `1/9xx360° = 40°` |
| Cakes and pastries | 160 | `160/720 = 2/9` | `2/9xx360° = 80°` |
| Biscuits | 120 | `120/720 = 1/6` | `1/6xx360° = 60°` |
| Others | 40 | `40/720 = 1/18` | `1/18xx360° = 20°` |
Now, we make the pie chart:
Video Tutorials
Shaalaa.com | Drawing Pie Charts
to track your progress
