Topics
Microeconomic Theory
Microeconomics and Macroeconomics: Introduction
Theory of Income and Employment
Demand and Law of Demand
- Role of Demand and Supply in Economics
- Paul A. Samuelson: Father of Modern Economics
- Concept of Demand
- Types of Demand
- Determinants of Demand
- Demand Function
- Law of Demand
- Demand Schedule
- Individual Demand Schedule
- Market Demand Schedule
- Demand Curve
- Individual Demand Curve
- Market Demand Curve
- Reasons for the Downward Slope of the Demand Curve
- Importance of the Law of Demand
- Exceptions to the Law of Demand
- Movement along the Demand Curve and Shift of the Demand Curve
- Change in Quantity Demanded: Movement along the Demand Curve
- Change in Demand – Shift in Demand Curve
- Difference Between Extension and Increase in Demand
- Difference Between Contraction and Decrease in Demand
Theory of Consumer Behaviour: Marginal Utility and Indifference Curve Analysis
- Basic Concepts of Microeconomics > Utility
- Cardinal Approach (Utility Analysis)
- Total Utility and Marginal Utility
- Relationship Between Total Utility and Marginal Utility
- Approaches to Consumer Behaviour
- Law of Diminishing Marginal Utility
- Alfred Marshall: Key Contributor to Economics
- Consumer's Equilibrium through Cardinal Utility Approach
- Law of Equi-Marginal Utility
- Importance and Limitations of law of Equi-Marginal Utility
- Ordinal Utility Analysis/Indifference Curve Analysis
- Marginal Rate of Substitution (MRS)
- Relationship Between Marginal Rate of Substitution and Marginal Utility
- Properties of Indifference Curves
- Price Line or Budget Line
- Consumer's Equilibrium through Indifference Curve Approach
Money and Banking
Balance of Payment and Exchange Rate
Elasticity of Demand
- Concept of Elasticity of Demand
- Types of Elasticity of Demand > Price Elasticity
- Methods of Measuring Price Elasticity of Demand
- Percentage or Proportionate Method
- Total Expenditure Method
- Point Method (Geometric Method)
- Arc Elasticity of Demand
- Revenue Method
- Numerical Problems of Price Elasticity of Demand
- Factors Affecting Price Elasticity of Demand
- Importance of Elasticity of Demand
- Types of Elasticity of Demand > Income Elasticity
- Types of Elasticity of Demand > Cross Elasticity
Supply: Law of Supply and Price Elasticity of Supply
- Concept of Supply
- Determinants of Supply
- Law of Supply
- Movements Along and Shifts in Supply Curve
- Elasticity of Supply
- Price Elasticity of Supply
- Categories (Degrees) of Elasticity of Supply
- Measurement of Elasticity of Supply > Percentage Method
- Measurement of Elasticity of Supply > Geometric or Point Method
- Determinants of Elasticity of Supply
Public Finance
Market Mechanism: Equilibrium Price and Quantity in a Competitive Market
- Basic Concepts of Equilibrium and Equilibrium Price
- Equilibrium Price and Quantity in a Competitive Market
- Effects of Changes (Shifts) in Demand on Equilibrium Price and Equilibrium Quantity
- Effects of Changes (Shifts) in Supply on Equilibrium Price and Equilibrium Quantity
- Effects of Simultaneous Changes (Shifts) in Demand and Supply
- Some Special Cases of Equilibrium
- Applications of Tools of Demand and Supply Price Control
- Mаximum Price Legislation or Price Ceiling and Rationing
- Minimum Price Legislation or Floor Price
National Income
Laws of Returns: Returns to a Factor and Returns to Scale
- Basics of Production Theory
- Products
- Factors of Production
- Production Function
- Types of Production Functions
- Basic Product Concepts
- Relationship between Average Product (AP) and Marginal Product (MP)
- Relationship between Total Product (TP) and Marginal Product (MP)
- Law of Variable Proportions
- Three Stages of Production
- Stages of Operation and the Decision to Produce
- Variation of Output in the Short-Run Returns to a Factor
- Changes in Production
- Explanation of the Law of Variable Proportions
- Variation of Output in the Long Run - Returns to Scale
- Law of Variable Proportions and Returns to Scale Compared
- Scale of Production and Concept of Indivisibility
- Economies of Scale
- Diseconomies of Scale
- Significance of Economies of Scale
Cost and Revenue Analysis
- Cost of Production
- Theories of Costs: Traditional Theory of Costs/Short Run Cost Curves
- Cost Concepts > Total Costs
- Cost Concepts > Average Cost
- Cost Concepts > Marginal Cost
- Costs in Long Run Period
- Difference Between Short - Run & Long Run Costs
- Behaviour of Cost in the Short - Run
- Relationship between Average and Marginal Cost
- Long-Run Cost Curves
- Revenue Concepts
- Types of Revenue
- Relation Between Total, Average and Marginal Revenue
- Relationship between Total, Average and Marginal Revenues under Perfect Competition
- Relationship between Total, Average and Marginal Revenue under Imperfect Competition
- Relationship Between (Mutual Determination) AR, MR, and Elasticity of Demand
- Comparative Study of Revenue Curves under Different Markets
- Significance of Revenue Curve
Forms of Market
- Concept of Market
- Market Structure
- Classification of Market Structure
- Perfect Competition
- Monopoly
- Monopolistic Competition
- Oligopoly
- Duopoly
- Bilateral Monopoly
- Concept of Monopsony
- Other Forms of Market
- Factors Determining Market / Extent of Market
- Demand Curves of Firms under Different Market Forms
- Comparison between different forms of market
Producer's Equilibrium
Equilibrium of Firm and Industry Under Perfect Competition
- Concept of Equilibrium in Economics
- Firm's Equilibrium
- Producer's (Firm's) Equilibrium: Total Revenue and Total Cost Approach
- Producer's (Firm's) Equilibrium: Marginal Revenue and Marginal Cost Approach
- Determination of Short Run Equilibrium of a Firm
- Firm is a Price Taker, Not a Price Maker
- Determination of Long Run Equilibrium of a Firm
- Equilibrium of Industry
- Difference Between Firm and Industry's Equilibrium
Producer's Equilibrium Under Perfect Competition
Determination of Equilibrium Price and Output Under Perfect Competition
- Perfect Competition
- Price Determination Under Perfect Competition
- Changes in Equilibrium
- Effects of Changes (Shifts) in Demand on Equilibrium Price and Equilibrium Quantity
- Time Element in the Theory of Price Determination
- Determination of Equilibrium Prices
- Normal Price and Law of Returns
- Comparison between Market Price and Normal Price
- Practical Applications of Tools of Demand and Supply Analysis
- Determination of Short Run Equilibrium of a Firm
- Determination of Long Run Equilibrium of a Firm
Price Output Determination Under Monopoly
Price Output Determination Under Monopolistic Competition and Oligopoly
- Imperfect Competition
- Monopolistic Competition
- Equilibrium Price and Output under Monopolistic Competition
- Group Equilibrium in Monopolistic Competition
- Product Differentiation
- Selling Costs
- Oligopoly
- Price and Output Determination under Oligopoly
- Price Rigidity-Sweezy's Kinky Demand Curve Model or Equilibrium under Independent Action
- Cournot's Model
- Collusive Oligopoly
- Mergers
Theory of Income and Employment
- Basic Model of Income Determination
- Aggregate Demand and Its Components
- Propensity to Consume or Consumption Function
- Propensity to Save
- Investment Expenditure
- Determination of Equilibrium Income and Output
- Saving-investment Approach
- Investment Multiplier and Its Mechanism
- Solved Problems on Consumption and Income
- The Concept of Full Employment
- Important Terms of Employment and Unemployment
- Excess Demand
- Deficient Demand
Basic Concepts of Macro Economics
Aggregate Demand and Supply-Determinants of Equilibrium
Consumption Function (Propensity to Consume)
- Propensity to Consume or Consumption Function
- Kinds or Technical Attributes of Propensity to Consume > Average Propensity to Consume
- Kinds or Technical Attributes of Propensity to Consume > Marginal Propensity to Consume
- Propensity to Save
- Determinants of Propensity to Consume
- Psychological Law of Propensity to Consume
- Measures to Raise Propensity to Consume
Concept of Investments-Types and Determinants
Multiplier - I : Static and Dynamic
Full Employment and Voluntary Unemployment
Problems of Deficient Demand and Excess Demand
Measures to Correct Deficient and Excess Demand
Money: Meaning and Functions
Banks: Commercial Bank and Central Bank
- Concept of Bank
- Types of Bank
- Commercial Banks
- Banking > Functions of Commercial Bank
- Credit Creation by Commercial Banks
- Role of Commercial Banks in an Economy
- Central Bank
- Comparison Between Central Bank and Commercial Banks
- Central Bank as a Controller of Credit
- Methods of Credit Control
- Quantitative Methods
- Qualitative (Or Selective) Methods
Balance of Payment and Exchange Rate
- Concept of Balance of Payments
- Features of Balance of Payment
- Balance of Trade and Balance of Payments- Comparison
- Structure of Balance of Payment
- Methods to Measure Balance of Payments
- Components of Balance of Payments
- Current Account Transactions
- Capital Account Transactions
- Balance of Payments Always Balances
- Categories of Balance of Payments
- Balance of Payments Disequilibrium
- Measures to Correct Disequilibrium in the Balance of Payments
- Foreign Exchange Rate
- Exchange Rate
- Types of Foreign Exchange Rate
- Fixed Rate of Exchange
- Flexible Rate of Exchange
- Managed Floating Exchange Rate System
- Determination of Equilibrium Rate of Exchange
- Factors or Determinants of Foreign Exchange Rate
- Concepts of Depreciation, Appreciation, Devaluation and Revaluation
- Determination of Exchange Rate in a Free Market
Fiscal Policy
- Structure of Public Finance > Fiscal Policy
- Public Finance
- Instruments of Fiscal Policy
- Objectives of Fiscal Policy
- Miscellaneous Objectives of Fiscal Policy
- Fiscal Measures for Stabilisation
- Methods of Fiscal Policy in Developing Countries
- Limitations of Fiscal Policy
- Structure of Public Finance > Public Revenue
- Instruments of Fiscal Policy - Taxation
- Types of Taxes
- Tax Reforms in India
- Proportional, Progressive and Regressive Taxes
- Structure of Public Finance > Public Expenditure
- Importance of Public Expenditure
- Structure of Public Finance > Public Debt
- Reasons for Borrowing by the Government
- Public Debt - Redemption
- Deficit Financing
- Fiscal Policy in Action
Government Budget
- Budget
- Types of Budget
- Government Budget
- Need and Importance of Government Budget
- Types of Government Budget in India
- Components (Structure) of the Government Budget
- Modern Classification of Budget
- Classification of Budget Receipts
- Balanced Budget Vs Unbalanced Budget
- Zero-Base Budgeting (ZBB)
- Zero-Base Budgeting in India
- Concepts Related to Budget Deficits
- Constituents of budget /Structure of the budget
- Structure of Public Finance > Public Expenditure
- Revenue Expenditure and Capital Expenditure
- Developmental and Non-developmental Expenditure
- Tax Revenue
- Public Revenue > Non-tax Revenue
- Capital Receipts
- Objectives of Budget
- Significance of Budget
- Types of budget deficit
- Budgetary Procedure
National Income and Circular Flow of Income
- Concept of National Income
- Domestic Income
- National Income Aggregates
- Significance or Importance of National Income
- Circular Flow of Income
- Circular Flow in a Closed Economy
- Circular flow and the Equality between Production, Income and Expenditure
- Circular Flow in a Open Economy
- Economic Sectors of an Economy
- Two-Sector Model without Savings and Investment
- Two-Sector Model with Savings and Investment
- Three-Sector Model of Circular Flow of Income
- Four-Sector Model of Circular Flow of Income
- Significance or Importance of Circular Flow of Income
National Income Aggregates
- Key Relationships Among National Income Aggregates
- National Income Aggregates
- Gross Domestic Product at Market Price
- Gross National Product at Market Price
- Constituents of GNP
- Net Domestic Product at Market Price
- Difference between Net Domestic and Net National Product at Market Price
- Net National Product (NNP)
- Difference between Net National and Gross National Product at Market Price
- Net National Income or Product at Factor Cost
- Net Domestic Product or Income at Factor Cost
- Difference between Net Domestic Product at Factor Cost and Net Domestic Product at Market Price
- Gross Domestic Product or Income at Factor Cost
- Gross National Product at Factor Cost
- Factor Income from Net Domestic Product accuring to Private Sector
- Private Income
- Difference between National and Private Income
- Personal Income of National Income
- Difference between Private and Personal Income
- Disposable Income Aggregates
- Per Capita Income
- Real Income
- Interrelationship among National Income Aggregates
- Real GDP and Nominal GDP
- Gross Domestic Product (National Income) and Economic Welfare
Methods of Measuring National Income
- Concept of National Income
- Methods of Measurement of National Income
- Net Product or Value Added Method
- Precautions in the Estimation of National Income by Value-added Method
- Difficulties in the Estimation of National Income by Value-added Method
- Income Method
- Expenditure Method
- Precautions in the Estimation of National Income by Expenditure Method
- Alternative Methods of National Income Estimation
- Reconciling The Three Methods Of Estimating National Income
- Components of Net National Product at Factor Cost in its Three Phases
- Transactions Included in National Income
- The Identity of Output, Income and Expenditure
- Significance of three Methods
- Transactions not Included in National Income
- Numericals on Income, Product and Expenditure Method
National Income and Economic Welfare
- Welfare Economics
- Definitions of Welfare Economics
- Factors Determining the Size of National Income
- National Income and National Welfare
- Relation between Economic Welfare and National Income
- National Income as a Measure of Economic Welfare
- Causes of Slow Growth of National Income
- Suggestions for Increasing National Income
- Revenue and Cost Curves under Perfect Competition
- TR as area under MR (price) curve
- TVC as area under MC curve
- Real-Life Application
- Key Points: Revenue and Cost Curves under Perfect Competition
CISCE: Class 12
Revenue and Cost Curves under Perfect Competition
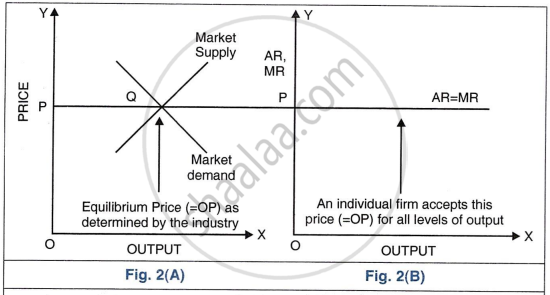
- In a perfectly competitive market, the market price of a commodity is fixed by the intersection of total market demand and total market supply of all firms in the industry.
- A single firm is too small to influence this price, so it is a price taker and can sell any quantity at the given market price.
CISCE: Class 12
TR as area under MR (price) curve
Numerical illustration (using the given table)
| Output (Q) | TR (₹) | MR (₹) = TRn − TRn−1 |
|---|---|---|
| 0 | 0 | – |
| 1 | 10 | 10 − 0 = 10 |
| 2 | 20 | 20 − 10 = 10 |
| 3 | 30 | 30 − 20 = 10 |
| 4 | 40 | 40 − 30 = 10 |
- TR increases by ₹10 for every extra unit of output.
- Hence, MR is constant at ₹10 and is equal to AR and the price for each unit.
- At output 4 units, TR=₹40, which is the sum of MR for all 4 units: 10 + 10 + 10 + 10 = ₹40
This constant‑price, constant‑MR pattern matches the standard Class 12 treatment of revenue under perfect competition.
CISCE: Class 12
TVC as area under MC curve
- TVC is obtained by adding the marginal cost of each extra unit.
- If MC is drawn as a curve against output, the sum of marginal costs from unit 1 to unit OL is represented by the area under the MC curve between 0 and OL.
- Therefore:
TVC = area under the MC curve over the relevant range of output.
CISCE: Class 12
Real-Life Application
- Imagine many farmers selling the same quality of wheat in a large grain market.
- The mandi price per kg is set by overall demand and supply for wheat in that region.
- A single farmer cannot influence this price; whether the farmer brings 10 bags or 100 bags, each kg sells at the same market price.
- For this farmer, price = AR = MR, and total revenue is simply price multiplied by quantity of wheat sold.
This type of “farmer in a competitive market” example is commonly used by major platforms to explain perfect competition.
CISCE: Class 12
Key Points: Revenue and Cost Curves under Perfect Competition
- Under perfect competition, the industry sets the market price where market demand equals market supply.
- An individual firm is a price taker; it faces a perfectly elastic demand curve at the market price.
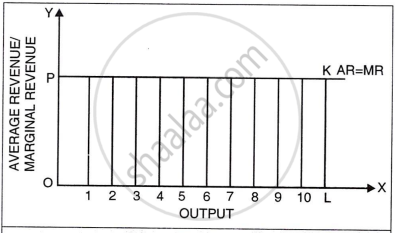
- For the firm, Price = AR = MR, and the AR and MR curves coincide as a horizontal line.
- With constant price, MR is constant and TR rises at a constant rate as output increases.
- TR at a given output equals the area under the MR (price) curve up to that output.
- TVC equals the area under the MC curve, just as TR equals the area under MR.
