Topics
Field Visit
Location and Extent
- Introduction to India and Brazil
- Indian - Location, Size and Extent
- Brazil - Location, Size and Extent
- Historical Background of India
- Historical Background of Brazil
- Difference Between Post-Independence Characteristics of India and Brazil
Physiography and Drainage
- Map Study: Physical Divisions of India
- Map Study: Physical Divisions of Brazil
- Physical Division of India> The Himalayas
- Physical Division of India > North Indian Plains
- Physical Division of India > The Peninsula
- Physical Division of India > The Coastal Plains
- Physical Division of India > The Island Group
- Physical Division of Brazil> The Highlands
- Physical Division of Brazil> The Great Escarpment
- Physical Division of Brazil> The Coasts
- Physical Division of Brazil> The Plains
- Physical Division of Brazil> Islands
- Comparative Study of the Ganga and Amazon River Basins
- Drainage of Brazil
- Drainage of India
Climate
- Map Study: Temperature and Rainfall Distribution (Brazil)
- Map Study: Temperature and Rainfall Overview (India)
- Temperature & Rainfall Graphs of Brazil
- Climate of Brazil
- Temperature & Rainfall Graphs of India
- Climate of India
Natural Vegetation and Wildlife
- Brazil: Physiography, Natural Vegetation and Wildlife
- Brazil Vegetation
- India Vegetation
- Brazil Wildlife
- India-Wildlife
Population
- Population of India
- Population in Brazil
- Population Composition of Brazil and India> Sex Ratio
- Population Composition of Brazil and India> Age and Sex Pyramid
- Population Composition of Brazil and India> Population Growth Rate
- Population Composition of Brazil and India> Life Expectancy
- Population Composition of Brazil and India> Literacy Rate
Human Settlements
Economy and Occupations
Tourism, Transport and Communication
- Map Study: Tourism Trends in Brazil and India
- Tourism in Brazil
- Tourism in India
- Brazil Transport
- India Transport
- Communication in Brazil
- Communication in India
Geography - Physical Divisions of India
Identification of Physical divisions
- Identification of Physical Divisions
Geography - North Indian Mountains
Himalayas
Associated mountains
- Concept of Associated Mountains
Geography - North Indian Plain Region
Deserts
- Desert
Western Plains
- Concept of Western Plains
Central Plains
- Concept on Central Plains
Delta region
- Concept of Delta Region
Eastern Plains
- Concept of Eastern Plains
Geography - Peninsular Plateau Region
Chhotta Nagpur Plateau
- Concept for Chhotta Nagpur Plateau
Malwa Plateau
- Concept on Malwa Plateau
Maharashtra Plateau
- Concept for Maharashtra Plateau
Karnataka Plateau
- Concept for Karnataka Plateau
Telangana Plateau
- Concept for Telangana Plateau
Geography - Western Ghats and Eastern Ghats
Eastern Ghats
- Concept on Eastern Ghats
Sahyadries
- Concept on Sahyadries
Geography - Coastal Region
- Geography - Coastal Region
Eastern coastal plain
- Coastal Region - Eastern Coastal Plain
- Concept for Western Coastal Plain
Western coastal plain
- Concept for Western Coastal Plain
Geography - Indian Islands
- Geography - Indian Islands
Eastern Islands
- Indian Islands - Eastern Islands
Western Islands
- Indian Islands - Western Islands
Geography - Practical 1
Cartography
- Concept on Cartography
Geography - Practical 2
Two dimensional diagrams
- Two Dimensional Shapes
One dimensional diagrams
- Concept on One Dimensional Diagrams
Economics - Introduction of an Economy
Introduction of an Economy
- Types of Economy
- Main Features of Economy
Economics - Basic problems of an economy solution
Solutions
Problems
- Introduction of Basic Problems of an Economy
- Problems- for Whom to Produce
- Problem - How Much to Produce
- Problem - by Whom to Produce
Economics - Inflation
Introduction
Effects of inflation
- Effects of Inflation
Measures of Inflation
- Measures of Inflation
Causes of inflation
- Causes of Inflation
Economics - Public distribution system and consumer protection
- Measures of Inflation
Public Distribution system - meaning and explanation
- Public Distribution System - Meaning and Explanation
Introduction
- Introduction of Public Distribution System and Consumer Protection
Objectives of Public Distribution system
- Objectives of Public Distribution System
Remedial Measures
- Remedial Measures Public Distribution System and Consumer Protection
Consumer Protection
- Consumer Protection - Rights and Duties of Cunsumer, Food Adulteration
Drawbacks of Public Distribution system
- Drawbacks of Public Distribution System
Progress of Public Distribution system
- Progress of Public Distribution System
Notes
Urbanisation in Brazil
- Brazil is one of the few developing countries which is highly urbanised. Brazil's significant urbanisation is unique, and it is one of the underlying factors contributing to the country's current rapid economic growth. Today, cities house approximately 86% of the Brazilian population.
- In Brazil, the term 'urban' is not well defined. Rapid urbanisation occurred in Brazil, primarily in the south and south-east, with Sao Paulo emerging as a major, metropolitan, and industrial area. Looking at this growth in a few areas of the country, the government is promoting a "Go West" policy that will lessen pressure on a few areas where the population is concentrated and reduce regional imbalance in the country.
- Urbanization has occurred more in coastal states than the states in the interior of the Brazil. States such as Sao Paulo, Goias, and Minas Gerais have a higher urban population density than states in the north. Because the population in the Amazon basin and the Brazilian highlands is lower, so is urbanisation. Manus is a port on the confluence of the Negro and the Amazon in this region. Here, urbanisation has occurred.
Example
Look at the table given, which shows the growth of the share of the urban population in the total population of Brazil. Draw a line graph from this table. Examine the graph carefully and answer the following questions.
Brazil percentage of urban population (1960 to 2010)
| 1960 | 1970 | 1980 | 1990 | 2000 | 2010 |
| 47.1 | 56.8 | 66 | 74.6 | 81.5 | 84.6 |
- What is the interval of the data?
- In which period did urbanisation occur rapidly?
- Write five sentences analysing the graph.
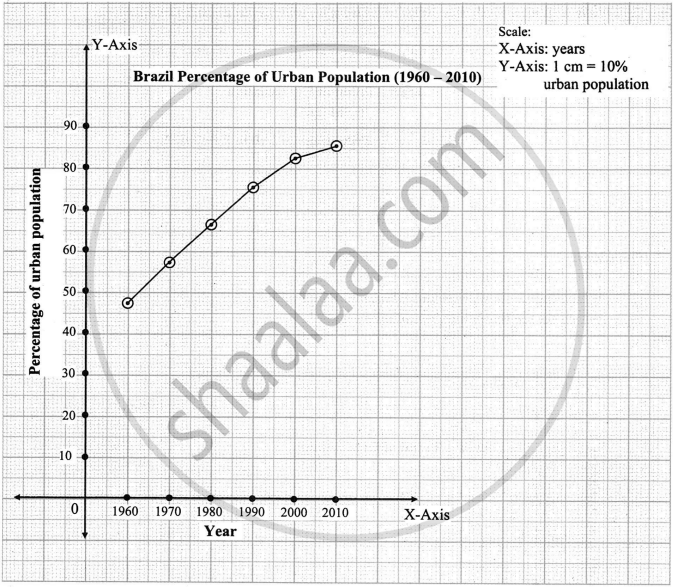
- The interval of data is 10 years.
- Urbanization occurred rapidly in the decade 1960 to 1970.
- The graph can be analysed as follows:
- The graph shows the percentage of urbanisation in Brazil from 1960 to 2010.
- In 1960, the level of urbanisation was 47.1%. During the next decade, by 1970, it increased by 9.7% and reached 56.8%.
- Urbanisation continued to increase after 1980, although the rate of growth became slower.
- Between 2000 and 2010, urbanisation in Brazil rose from 81.5% to 84.6%. However, the increase was only 3.1%.
- The graph clearly indicates that Brazil has experienced rapid urbanisation.
Example
Observe the two satellite images given below. Describe the settlements with respect to physiography. Considering the physiography, where could these settlements be located? Find out their settlement pattern and limitations with respect to their future growth.
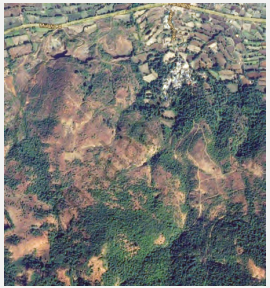
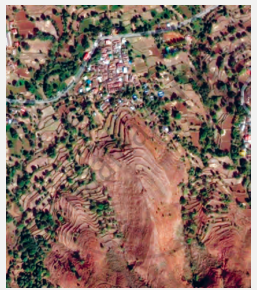
Both the satellite images depict the different images of the same area in a different period of time. In both instances, the area has desert-like physiography. Thus the settlements found in the region would be scattered. Scattered/dispersed settlements are those in which the habitation regions are isolated or located far away from each other. They are mostly found in the plateaus, deserts, hilly or forested areas.
The major limitations of the scattered settlement are:
- A threat to security: Since the people residing nearby are scattered, there will be serious security issues in the area.
- Isolation: The people residing in the area may experience isolation due to the lack of proper neighbours in the pattern of dispersed settlement.
- Poor transportation: The transportation network in the displaced settlement will be very poor owing to the topography of the region. This will be a very serious challenge to future development.
- Difficult to tackle emergency situations: In the scattered settlement, it becomes very difficult to get emergency relief, rescue and aid in case of any accidents or calamities.
Example
Study the choropleth map of Brazil showing the Statewise urban population of Brazil and answer the following questions.

- Which States (region) are the most urbanised?
- Which States (region) are the least urbanised?
- The states of Sao Paulo, Rio de Janeiro, Goias, Espirito Santo in the southeastern part of Brazil and the port Manaus in the north are the most urbanised.
- The states of Para, Maranhao and Piaui in northern part of Brazil are the least urbanised states.
Example
Which factors have affected urbanisation in Brazil?
- In Brazil, rapid urbanisation has taken place in South and South East Coastal regions.
- Being in proximity to the Atlantic Ocean have benefitted these regions immensely in the form of mild climatic conditions.
- Availability of water, fertile soil, natural minerals such as iron ore, good transport system and steady electric supply have positively impacted urbanisation in these parts.
- To the north of the Brazilian Highlands is the rain shadow region of ‘Drought Quadrilateral’ with sparse settlements.
Key Points: Urbanisation in Brazil
- Around 86% of Brazil’s population lives in urban areas, making it a highly urbanised developing country.
- Urbanisation in Brazil is mainly concentrated in the South and South-East, especially in Sao Paulo.
- The government promotes the "Go West" policy to reduce regional imbalance and population pressure.
- Coastal states have higher urbanisation than interior states; Sao Paulo, Goias, and Minas Gerais are more urban.
- Urbanisation is low in the Amazon Basin and the Brazilian Highlands, except in cities such as Manaus.
Related QuestionsVIEW ALL [11]
Look at the table given, which shows the growth of the share of the urban population in the total population of Brazil. Draw a line graph from this table. Examine the graph carefully and answer the following questions.
Brazil percentage of urban population (1960 to 2010)
| 1960 | 1970 | 1980 | 1990 | 2000 | 2010 |
| 47.1 | 56.8 | 66 | 74.6 | 81.5 | 84.6 |
- What is the interval of the data?
- In which period did urbanisation occur rapidly?
- Write five sentences analysing the graph.
Prepare a simple bar graph with the help of given statistical information and answer the questions given below-
Brazil-% of urban population
| Year | % of urban population |
| 1960 | 47.1 |
| 1970 | 56.8 |
| 1980 | 66.0 |
| 1990 | 74.6 |
| 2000 | 81.5 |
| 2010 | 84.6 |
Questions-
- What is the interval of years in the data?
- During which year did rapid urbanization start?
- Write five sentences about the analysis of graph.
