हिंदी

Kinds or Technical Attributes of Propensity to Consume > Average Propensity to Consume

Advertisements

Topics

Estimated time: 9 minutes
  • Consumption function and APC
  • Definition: Average Propensity to Consume
  • Formula: Average Propensity to Consume
  • Numerical illustration
  • Diagrammatic representation
CISCE: Class 12

Consumption function and APC

According to Keynes, consumption depends mainly on the level of income.
He studied this relationship using two technical concepts:

  • Average Propensity to Consume (APC)
  • Marginal Propensity to Consume (MPC)
CISCE: Class 12

Definition: Average Propensity to Consume

"The average propensity to consume is the ratio of consumption to income \[\left(\frac{\mathrm{C}}{\mathrm{Y}}\right)\] at a specific level of income. It is the proportion of a given income that is spent for consumption purposes."Peterson

CISCE: Class 12

Formula: Average Propensity to Consume

  • Average Propensity to Consume (APC) = $$\frac{Total\ Consumption\ (C)}{Total\ Income\ (Y)}$$
  • Symbolically: \[\mathrm{APC}=\frac{C}{Y}\]

Where:

  • C = total consumption expenditure
  • Y = total income
CISCE: Class 12

Numerical illustration

Table: Aggregate income, consumption and APC

Aggregate income (₹ crore) Aggregate consumption (₹ crore) APC = C/Y
150 100 100/150 = 0.66 (66%)
250 150 150/250 = 0.60 (60%)
350 175 175/350 = 0.50 (50%)

From Table :

  • When income is ₹150 crore and consumption is ₹100 crore, APC = 0.66. The community spends 66% of its income on consumption.
  • At income ₹250 crore and consumption ₹150 crore, APC falls to 0.60 (60%).
  • At income ₹350 crore and consumption ₹175 crore, APC falls further to 0.50 (50%).

Thus, as income increases, APC tends to decline because consumption rises less than proportionately to income.

CISCE: Class 12

Diagrammatic representation

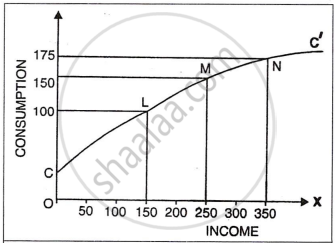
In Fig. , income is shown on the horizontal (OX) axis and consumption on the vertical (OY) axis.
The curve CC′ is the consumption curve, which is drawn by joining points like L, M and N showing different income–consumption combinations.

  • Point L represents income of ₹150 crore and consumption of ₹100 crore.
  • Point M represents income of ₹250 crore and consumption of ₹150 crore.
  • Point N represents income of ₹350 crore and consumption of ₹175 crore.

If we divide the vertical coordinate (consumption) of each point by its horizontal coordinate (income), we get APC at that income level.
As we move to the right along the CC′ curve (from L to M to N), the curve becomes flatter, showing that APC is falling with rise in income (from 0.66 to 0.60 to 0.50).

Test Yourself

Advertisements
Share
Notifications

Englishहिंदीमराठी


      Forgot password?
Use app×