Topics
Microeconomic Theory
Demand
- Introduction to Microeconomics and Macroeconomics
- Microeconomics
- Macroeconomics
- Macroeconomics Vs Microeconomics
- Introduction to Demand
- Meaning of Demand
- Features of Demand
- Types of Demand
- Determinants of Demand
- Demand Function
- Quantity Demanded and Demand
- Law of Demand
- Demand Schedule
- Demand Curve
- Individual Demand Curve to Market Demand Curve
- Slope of the Demand Curve
- Linear Demand Curve
- Reasons for the Downward Slope of the Demand Curve
- Importance of the Law of Demand
- Exceptions to the Law of Demand
- Movement Along the Demand Curve
- Change in Demand – Shift in Demand Curve
- Difference Between Extension and Increase in Demand
- Difference Between Contraction and Decrease in Demand
- Cross Price Effects
- Relationship Between Income and Demand
- Impact of Tastes and Preferences on Demand for a Commodity
- Industry Demand Vs Firm Demand
- Concept of Utility
- Cardinal Utility Analysis / Marginal Utility Analysis
- Types of Marginal Utility
- Total Utility and Marginal Utility
- Forms of Utility
- Features of Utility
- Relationship Between Total Utility and Marginal Utility
- Law of Diminishing Marginal Utility
- Exceptions of the Law of Diminishing Marginal Utility
- Importance of the Law of Diminishing Marginal Utility
- Consumer's Equilibrium through Cardinal Utility Approach
- Law of Equi-Marginal Utility
- Exceptions of the Law of Equi-marginal Utility
- Importance of the Law of Equi-marginal Utility
- Ordinal Utility Analysis/Indifference Curve Analysis
- Indifference Schedule
- Indifference Curve
- Indifference Map
- Marginal Rate of Substitution (MRS)
- Assumptions of Indifference Curve Analysis
- Properties of Indifference Curves
- Price Line or Budget Line
- Consumer's Equilibrium through Indifference Curve Approach
- Comparison of Utility Theory and Indifference Curve Theory
- Consumer's Equilibrium through Indifference Curve Approach
- Relationship Between Marginal Rate of Substitution and Marginal Utility
Theory of Income and Employment
- Introduction to Theory of Income and Employment
- Basic Model of Income Determination
- Aggregate Demand and Its Components
- Desired (Ex Ante) and Effective Demand (Ex Post)
- Propensity to Consume or Consumption Function
- Propensity to Save - Saving Function
- Relationship Between Consumption and Saving Functions
- Derivation of Saving Function
- Investment Expenditure
- Private and Public Investment
- Induced and Autonomous Investment
- Determination of Equilibrium Income and Output
- Concept of Aggregate Demand and Aggregate Supply
- Saving-investment Approach
- Investment Multiplier
- Investment Multiplier Defined
- The Multiplier Mechanism
- Graphic Presentation of Multiplier
- Derivation of Multiplier Formula
- Solved Numerical Problems on Propensity to Consume and Save, Equilibrium Income and Multiplier
- Meaning of Full Employment and Voluntary Unemployment
- The Concept of Full Employment
- Voluntary and Involuntary Unemployment
- Excess Demand
- Measures to Correct the Excess Demand
- Deficient Demand
- Measures to Correct Deficient Demand
- Deficient and Excess Demand and Business Cycle
- Aggregate Demand in a Three - Sector Economy
- Features of the Consumption Function
- Shifting of the Consumption Function
- Importance of the Consumption Function
- Gross Investment and Net Investment
- Paradox of Thrift
- Variables
- Partial and General Equilibrium
- Static Analysis
- Comparative Static Analysis
- Dynamic Analysis
- Difference between Static and Dynamic Analysis
- Psychological Law of Propensity to Consume
- Measures to Raise Propensity to Consume
- Importance of Investment
- Static Multiplier
- Dynamic Concept of Multiplier
- Limitations of Multiplier
- Leakages of Multipler
- Importance of Multiplier
- Types of Multiplier
- Balanced-Budget Multiplier
- Unemployment Associated with Full Employment
- Inflationary Gap
- Foreign Trade Policy
Elasticity of Demand
- Introduction to Elasticity of Demand
- Meaning and Types of Elasticity of Demand
- Price Elasticity of Demand
- Classification of Price Elasticity - Degrees of Price Elasticity of Demand
- Methods of Measuring Price Elasticity of Demand
- Percentage or Proportionate Method
- Total Expenditure Method
- Point Method (Geometric Method)
- Arc Elasticity of Demand
- Revenue Method
- Numerical Problems of Price Elasticity of Demand
- Factors Affecting Price Elasticity of Demand
- Importance of Elasticity of Demand
- Income Elasticity of Demand
- Types of Income Elasticity of Demand
- Importance of Income Elasticity
- Cross Elasticity of Demand
- Туpes of Cross Elasticity of Demand
- Limitations of Cross Elasticity of Demand
- Importance of Cross Elasticity of Demand
Money and Banking
- Introduction to Money and Inflation
- Concept of Money
- Features of Money
- Barter system
- Difficulties of Barter System of Exchange
- Evolution of Money
- Qualities of Good Money
- Modern Forms of Money
- Functions of Money
- Primary Functions
- Secondary Functions
- Contingent Functions
- Importance of Money
- Supply of Money
- Measures of Money Supply
- Inflation
- Types of Inflation
- Introduction to Banking System
- Types of Bank
- Functions of Commercial Bank
- Central Bank
- Functions of Central Bank
- Methods of Credit Control by the Central Bank
- Quantitative Methods of Credit Control by the Central Bank
- Qualitative Methods of Credit Control by the Central Bank
- Difference Between the Central Bank and the Commercial Banks
- Role of Banks in the Economy
- Indian Monetary System
- Constitutents of Money Supply
- Reserve Bank of India's Approach of Money Supply
- Factors Affecting Money Supply
- Commercial Banks
- Process of Credit Creation by Commercial Banking System
- Factors Affecting Credit Creation
- High Powered Money
- Classification or Structure of Commercial Banks in India
- Components of Money Supply
- Evolution of Central Bank
- Need for a Central Bank
- Importance of Central Bank
Supply
- Concept of Supply
- Individual and Market Supply
- Distinction Between Supply and Stock
- Determinants of Supply
- Supply Function
- Law of Supply
- Supply Schedule
- Supply Curve
- Derivation of Market Supply Curve From Individual Supply Curves
- Explanation of the Law of Supply
- Time Period and Supply
- Exceptions to the Law of Supply
- Movement Along the Supply Curve Or Expansion and Contraction of Supply
- Shift of the Supply Curve or Change in Supply
- Expansion of Supply and Increase in Supply
- Contraction of Supply and Decrease in Supply
- Elasticity of Supply
- Meaning and Types of Elasticity of Demand
- Price Elasticity of Supply
- Categories (Degrees) of Elasticity of Supply
- Measurement of Elasticity of Supply > Percentage Method
- Measurement of Elasticity of Supply > Geometric or Point Method
- Determinants of Elasticity of Supply
- Importance of Elasticity of Supply
Balance of Payments and Exchange Rate
- Concept of Balance of Payments
- International Linkages
- Open Economy and Its Linkages
- Balance Payment
- Definitions of Balance Payments
- Meaning of Balance of Payments
- Balance of Trade
- Balance of Invisible Trade
- Components of Balance of Payments
- Current Account
- Capital Account
- Categories of Balance of Payments
- Balance of Trade vs Current Account Balance
- Structure of Balance of Payments
- Methods to Measure Balance of Payments
- Capital Account Balance
- Balance of Payments Surplus and Deficit
- Autonomous and Accommodating Items
- Balance of Payments Disequilibrium
- Terms of Trade - Errors and Omissions Excepted (E&OE)
- Causes Behind Unfavourable Bop
- Remedies for Unfavourable Bop
- Monetary and Fiscal Policies to Correct Disequilibrium in the BOP Account
- Fiscal policies
- Foreign Exchange Rate
- Foreign Exchange
- Exchange Rate System
- Demand for Foreign Exchange
- Supply of Foreign Exchange
- Determination of Equilibrium Exchange Rate
- Shifts of the Demand Curve
- Shifts of the Supply Curve
- Advantages of Fixed Exchange Rate
- Disadvantages of Fixed Exchange Rate
- Advantages of Flexible Exchange Rate
- Disadvantages of Flexible Exchange Rate
- Types of Exchange Rate
- Factors Responsible for Exchange Rate Fluctuation
- Some Related Concepts of Exchange Rate
- Difference Between Devaluation and Depreciation
Market Mechanism
- Introduction to Market Mechanism
- Basic Concepts of Equilibrium and Equilibrium Price
- Equilibrium Price and Quantity in a Competitive Market
- Changes in Equilibrium
- Effects of Changes (Shifts) in Demand on Equilibrium Price and Equilibrium Quantity
- Effects of Changes (Shifts) in Supply on Equilibrium Price and Equilibrium Quantity
- Effects of Simultaneous Changes (Shifts) in Demand and Supply
- Some Special Cases of Equilibrium
- Importance of the Element in the Determination of Price
- Applications of Tools of Demand and Supply Price Control
- Mаximum Price Legislation or Price Ceiling and Rationing
- Minimum Price Legislation or Floor Price
- Important Areas of Applications of Tools of Demand and Supply Curves
- Meaning of Perfect Competition
- Assumptions and Conditions of Perfect Competition
- Pure and Perfect Competition
- Time Element in the Theory of Price Determination
- Determination of Equilibrium Prices
- Normal Price and Law of Returns
- Comparison between Market Price and Normal Price
- Practical Applications of Tools of Demand and Supply Analysis
Public Finance
- Introduction to Public Finance
- Public Revenue
- Nature and Significance of Taxes
- Tax and Fee
- Canons of Taxation
- Types of Taxes
- Merits of Direct Taxes
- Demerits of Direct Taxes
- Merits of Indirect Taxes
- Demerits of Indirect Taxes
- Direct Taxes vs Indirect Taxes
- Kinds of Tax System > Proportional tax
- Kinds of Tax System > Progressive Tax
- Kinds of Tax System > Regressive Tax
- Kinds of Tax System > Degressive Tax
- Kinds of Tax System > Digressive Tax
- Sources of Central Government Revenue
- Sources of State Government Revenues
- Value-Added Tax (VAT)
- Modified Value-Added Tax (MODVAT)
- MODVAT to CENVAT
- Public Expenditure
- Reasons for the Growth of Public Expenditures in India for Recent Times
- Importance of Public Expenditure in a Developing Country
- Public Debt
- Structure (Types) of Public Debt
- Reasons Behind Internal Public Debt
- Reasons Behind External Public Debt
- Methods of Redemption of Public Debt
- The Burden of Public Debt
- Main Sources of Internal & External Debt of the Government of India
- Distinction Between Internal Debt and External Debt
- Effects of Government Borrowings on the Indian Economy
- Fiscal Policy
- Objectives of Fiscal Policy
- Role of Fiscal Policy
- Instruments of Fiscal Policy
- Fiscal Measures for Stabilisation
- Effective Role of Fiscal Policy for Underdeveloped or Developing Country
- Limitations of Fiscal Policy
- Role of Fiscal Policy to Control Inflationary Situation
- Deficit Financing
- Reason for Deficit Financing
- Effects of Deficit Financing
- Limits of Deficit Financing
- Introduction to Budget
- Government Budget
- Need and Importance of Government Budget
- Objectives of Government Budget
- Types of Government Budget in India
- Modern Classification of Budget
- Balanced and Unbalanced Budget
- Unbalanced/Deficit - Surplus Budget
- Zero-Base Budgeting (ZBB)
- Zero-Base Budgeting in India
- Components (Structure) of the Government Budget
- Budget Receipts
- Revenue Receipts
- Tax Receipts
- Non-Tax Receipts
- Capital Receipts
- Budget Expenditure
- Revenue Expenditure and Capital Expenditure
- Plan Expenditure and Non-plan Expenditure
- Budget Deficits
- Budgetary Procedure
- Developmental and Non-developmental Expenditures
- Balanced Budget vs Deficit or Surplud Budget
Concepts of Production
- Concept of Production
- Product
- Factors of Production
- Production Function
- Short-run and Long-run
- Features of Production Function
- Types of Production Functions
- Some Basic Concepts - Total, Average and Marginal Physical Products
- Relationship between Average Product (AP) and Marginal Product (MP)
- Relationship between Total Product (TP) and Marginal Product (MP)
- Returns to a Factor - Laws of Returns to a Variable Factor
- Law of Variable Proportions
- Statement of the Law of Variable Proportions
- Assumptions of the Law of Variable Proportions
- Illustration of the Law of Variable Proportions
- Three Stages of Production
- Explanation of the Law of Variable Proportions
- Stages of Operation and the Decision to Produce
- Conditions Or Causes of Applicability
- Applicability of the Law of Variable Proportions
- Changes in Production
- Returns to a Factor or Law of Returns
- Law of Variable Proportions and Returns to Scale Compared
- Variation of Output in the Long Run - Returns to Scale
- Scale of Production
- Concept of Indivisibility
- Economies of Scale
- Diseconomies of Scale
Cost and Revenue
- Introduction to Cost of Production
- Money Cost Or Accounting Cost / Explicit Cost
- Economic Cost
- Opportunity Cost
- Real Cost
- Private and Social Cost
- Fixed Cost and Variable Cost
- Different Cost Concepts
- Total Cost Curves
- Average Cost Curves
- Marginal Cost (MC)
- Relationship between Average and Marginal Cost
- Long-Run Cost Curves
- Long-run Average Cost (LAC) Curve
- Long-run Marginal Cost (LMC) Curve
- LAC Curve U-shaped - Economies and Diseconomies of Scale
- Numerical Problems Long-run Cost Curves
- Revenue Concepts
- Behaviour of Revenue Under Different Market Structures
- Relationship Between Total, Average and Marginal Revenues Under Perfect Competition
- Relationship Between Total, Average and Marginal Revenue Under Imperfect Competition
- Significance of Revenue Curve
- Numerical Problems of Revenue
National Income
- Concept of National Income
- Вasic Concept about Domestic Territory
- Basic Concepts Related to Domestic Income and National Income
- Net Factor Income from Abroad (NFIA)
- Significance or Importance of National Income
- Circular Flow of Income
- Circular Flow of Income in a Two-Sector Economy
- Circular Flow of Income in a Two-Sector Economy with Savings and Investment
- Circular Flow of Income in a Three-Sector Economy
- Circular Flow of Income in a Four-Sector Economy
- Circular Flow in Open Economy
- Significance of Circular Flow of Income
- Equilibrium of the Flow of National Income Or Injections and Withdrawals
- Nature of Goods and Services
- Economic Goods and Non-Economic Goods
- Material and Non-Material Goods
- Consumer and Producer Goods
- Single-Use (Non-Durable) Goods and Durable Goods
- Intermediate Goods and Final Goods
- Important Concepts of National Income
- Gross Domestic Product
- Gross National Product
- Net Domestic Product
- Net National Product (NNP)
- National Disposable Income
- Net National Income or Product at Factor Cost
- Net Domestic Product or Income at Factor Cost
- Gross Domestic Product or Income at Factor Cost
- Gross National Product at Factor Cost
- Income from Domestic Product Accruing to Private Sector
- Private Income
- Microeconomics > Personal Income
- Basic Concepts of Microeconomics > Personal Disposable Income
- Relationship Between Arious National Income Aggregates
- Per Capita Income
- Real Income
- GDP and Welfare
- Circular Flow of Production, Income and Expenditure
- Methods of Measurement of National Income
- Income Method
- Classification of Factor Income
- Estimation of Factor Income
- Main Precautions in Income Method
- Output Method/Product Method
- Net Product or Value Added Method
- Main Precautions in Product Method
- Expenditure Method
- Measurement of Final Expenditure
- Estimation of National Income
- Main Precautions in Expenditure Method
- Summary of the Three Methods for Measurement of GDP
- Treatment of Items in the Estimation of GNP
- GNP and Economic Welfare
- Difficulties of Measuring National Income in a Less-Developed Economy
- Methods of Measurement of National Income
- Transactions Included in National Income
- Transactions not Included in National Income
Main Market Forms and Equilibrium of a Firm
- Concept of Market
- Market Structure
- Factors Determining Market Forms
- Perfect Competition
- Features of Perfect Competition
- Pure and Perfect Competition
- Monopoly
- Features of Monopoly
- Monopolistic Competition
- Features of Monopolistic Competition
- Oligopoly
- Features of Oligopoly
- Monopsony
- Features of Monopsony
- Duopoly
- Characteristics of Duopoly
- Bilateral Monopoly
- Other Forms of Market
- Factors Determining Market / Extent of Market
- Demand Curves of Firms under Different Market Forms
- Comparison between different forms of market
- Difference Between Imperfect Competition and Monopolistic Competition
- Firm : An Economic Entity
- Profit Maximisation Objective
- The Definition of Profits
- Rules for Profit-Maximisation
- Producer's (Firm's) Equilibrium: Total Revenue and Total Cost Approach
- Producer's (Firm's) Equilibrium: Marginal Revenue and Marginal Cost Approach
- Short-run Equilibrium
- Long-run Equilibrium
- Firm is a Price Taker, Not a Price Maker
- Equilibrium of Industry
- Difference Between Firm and Industry's Equilibrium
- Meaning of a Producer
- Producer's Equilibrium under Perfect Competition
- Determination of Price and Equilibrium Under Monopoly
- Monopoly Equilibrium and Laws of Costs
- Price Discrimination or Discriminating Monopoly
- Price and Output Discrimination Under Discriminating Monopoly
- Measures of Monopoly Power
- Nature of Demand and Cost Curves
- Equilibrium Price and Output under Monopolistic Competition
- Group Equilibrium in Monopolistic Competition
- Product Differentiation
- Selling Costs
- Equilibrium with Selling Costs
- Price and Output Under Oligopoly Indeterminate
- Price and Output Determination under Oligopoly
- Price Rigidity-Sweezy's Kinky Demand Curve Model or Equilibrium under Independent Action
- Reasons for Price Stability
- Cournot's Model
- Collusive Oligopoly
- Mergers
Market period price determination
The market period is a very short time in which the quantity already brought to the market cannot be changed. Supply is almost fixed, so demand mainly decides price.
Perishable goods
- Meaning: Goods that cannot be stored for long because they spoil quickly.
Examples: fresh vegetables, fruits, milk. - In a single market session (e.g., today’s morning vegetable market), the quantity available is fixed.
- Even if the price rises, sellers cannot increase today’s supply, so the supply curve is vertical.
Diagram idea
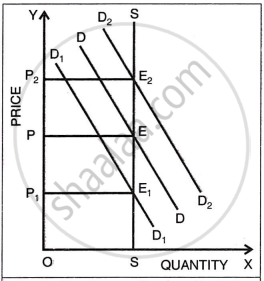
- Horizontal axis: quantity of the perishable good.
- Vertical axis: price.
- Supply curve SS is vertical (fixed supply).
- Original demand curve DD meets SS at E, giving equilibrium price OP.
- If demand increases to D₂D₂, the new equilibrium is at E₂, and the price rises to OP₂.
- If demand falls to D₁D₁, equilibrium shifts to E₁, and price falls to OP₁.
Key points – Perishable goods
- Supply is fixed in the market period.
- Any change in demand causes a large change in price.
- Demand has a dominant role in price determination here.
Durable goods
Durable goods can be stored and sold later, so sellers can decide how much to sell now and how much to hold back. Examples: wheat, rice, soap, oil.
- Total stock available in the market is fixed in the very short run, but not all of it must be sold immediately.
- Sellers may keep some stock back if the price is too low.
Reserve price
-
Sellers set a minimum acceptable price below which they prefer not to sell; this is called the reserve price.
Diagram idea
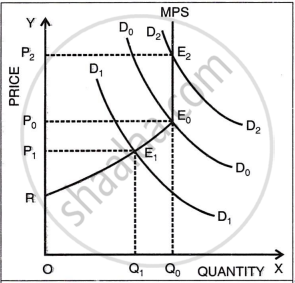
- Horizontal axis: quantity of the durable good.
- Vertical axis: price.
- Total stock: OQ₀.
- MPS is the market period supply curve for durable goods.
- At the reserve price OR, sellers may hold back the entire stock.
- If demand is D₁D₁:
i. Price is OP₁.
ii. Only OQ₁ is sold; the rest is held back. - If demand is D₀D₀:
i. Price is OP₀.
ii. The entire stock of OQ₀ is sold. - If demand is D₂D₂:
At equilibrium E₂, price OP₂, again all stock is sold, but at a higher price.
Key points – Durable goods
- Supply is not strictly vertical; part of the stock can be held back.
- Reserve price and expectations about the future determine how much is sold now.
- Demand still influences price, but seller behaviour and expectations also matter.
Factors affecting reserve price
- Expected future price
Expectation of higher future prices → higher reserve price today. - Liquidity preference (need for cash)
Urgent need for money → seller accepts a lower reserve price. - Expected future cost of production
Expected fall in future costs → lower reserve price today. - Storage expenses
High storage cost or long storage time → seller prefers to sell now → lower reserve price. - Durability of the commodity
More durable goods can be stored longer → higher reserve price. - Expected future demand
Expected rise in future demand → higher reserve price.
Short Period Price Determination
Think of the short period as “some time, but not enough to change the size of the factory”.
- Firms can change workers and raw materials but cannot build new factories or close down fully.
- The number of firms is fixed.
Diagram in words
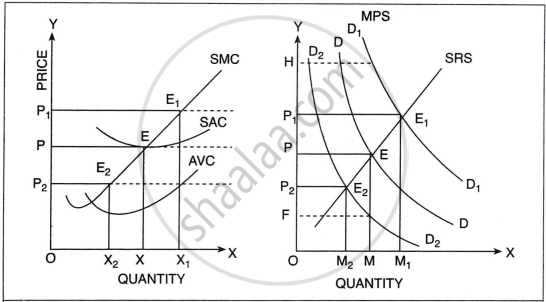
- Horizontal axis: quantity.
- Vertical axis: price.
- Draw a downward sloping line: demand (DD).
- Draw an upward-sloping line: short‑run supply (SRS).
- Where they meet is E → price P and quantity Q (short‑run equilibrium).
Now:
If demand increases (people want more):
- Draw a new demand curve to the right.
- The new meeting point is at a higher price and higher quantity.
- Firms use the same factory more intensively and can earn extra profit.
If demand falls:
- Draw demand to the left.
- The new point gives a lower price and lower quantity.
- Firms cut output and may face losses in the short run.
Long Period Price Determination
Think of the long period as “enough time for big changes”.
- Firms can change all inputs (build bigger plants, buy more machines).
- New firms can enter, and old firms can exit the industry.
Because of this:
- If profits are high for a long time, new firms enter, supply increases, and price falls.
- If losses continue → firms leave → supply decreases → price rises.
- Finally, price settles where firms get only normal profit (no big gain, no loss).
Diagram in words
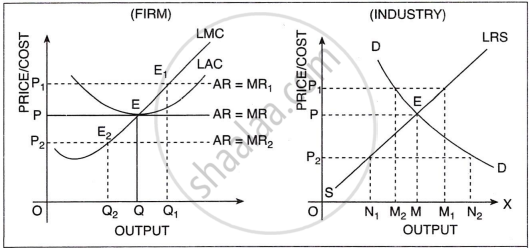
- Horizontal axis: output.
- Vertical axis: price.
- Draw a downward demand curve (DD).
- Draw a gently upward long‑run supply curve (LRS).
- Their meeting point is E → price P (normal price) and output Q.
If price is:
- Above P for some time → firms earn extra profit → new firms join → supply rises → price comes down to P.
- Below P for some time → firms bear losses → some firms close → supply falls → price goes up to P.
Key Points: Determination of Equilibrium Prices
- Time element (market, short, long period) is essential to explain how quickly supply can respond to demand and how price is determined.
- In the market period, supply is almost fixed; demand mainly decides price, especially for perishable goods.
- For durable goods in the market period, sellers can hold stock and use a reserve price, influenced by future expectations and storage costs.
- In the short period, firms adjust output using existing capacity; demand shifts cause changes in price, output, and short‑run profits or losses.
- In the long period, firms can change scale and enter/exit; the normal price is the long‑run equilibrium price where firms earn only normal profit and P = MC = minimum LAC.
