Topics
Introduction to Micro and Macro Economics
- Branches of Economics
- Father of Econometrics: Ragnar Frisch
- Microeconomics
- Macroeconomics
- Macroeconomics Vs Microeconomics
Micro Economics
Introduction to Micro Economics
- Analysis of Market Structure
- Microeconomics
- Micro Economics - Slicing Method
- Use of Marginalism Principle in Micro Economics
- Micro Economics - Price Theory
- Micro Economic - Price Determination
- Micro Economics - Working of a Free Market Economy
- Micro Economics - International Trade and Public Finance
- Welfare Economics
- Micro Economics - Useful to Government
- Assumption of Micro Economic Analysis
Consumers Behavior
Analysis of Demand and Elasticity of Demand
Analysis of Supply
Types of Market and Price Determination Under Perfect Competition
Factors of Production
- Factors of Production - Feature of Capital
- Factors of Production
Macro Economics
Utility Analysis
- Basic Concepts of Microeconomics > Utility
- Commodities and Their Specific Utility for Individuals
- Total Utility and Marginal Utility
- Law of Diminishing Marginal Utility
- Paradox of Value
- Relationship Between Marginal Utility and Price
- Indifference Curve Analysis by Hicks and Allen
Introduction to Macro Economics
- Macroeconomics
- Allocation of Resource and Economic Variable
National Income
Determinants of Aggregates
- Total Demand for Good and Services
- Concept of Aggregate Demand and Aggregate Supply
- Consumption
- Investment Demand
- Government Demand
- Foreign Demand
- Difference Betweeen Export and Import
- Effect of Population of Consumption Expediture
- Types of Investment Expenditure
- Micro Eco-Equilibrium
Money
- Concept of Money
- Functions of Money
- Standard of Deferred Payment
- Standard of Transfer Payment
- Money - Store of Value
- Barter system
- Monetary Payments
- Concept of Good Money
Commercial Bank
Central Bank
- Central Bank
- Central Bank Function - Banker's Bank
- Central Bank as a Controller of Credit
- Monetary Function of Central Bank
- Non Monetary Function of Central Bank
- Methods of Credit Control
- Repo Rate and Reverse Repo Rate
- Central Bank Function - Goverment Bank
Public Economics
- Introduction of Public Economics
- Features of Public Economics
- Government Budget
- Objectives of Government Budget
- Features of Government Budget
- Public Economics - Budget (1 Year)(1 April to 31 March)
- Types of Budget
- Taxable Income
- Budgetary Accounting in India
- Budgetary Accounting - Consolidated , Contingency and Public Fund
- Components (Structure) of the Government Budget
- Factor Influencing Government Budget
Demand Analysis
- Concept of Demand
- Demand Schedule
- Individual Demand Schedule
- Market Demand Schedule
- Demand Curve
- Individual Demand Curve
- Market Demand Curve
- Reasons for the Downward Slope of the Demand Curve
- Types of Demand
- Determinants of Demand
- Law of Demand
- Exceptions to the Law of Demand
- Variations in Demand
- Changes in Demand
Elasticity of Demand
- Concept of Elasticity of Demand
- Types of Elasticity of Demand > Income Elasticity
- Types of Elasticity of Demand > Cross Elasticity
- Types of Elasticity of Demand > Price Elasticity
- Perfectly Elastic Demand
- Perfectly Inelastic Demand
- Unitary Elastic Demand
- Relatively Elastic Demand
- Relatively Inelastic Demand
- Methods of Measuring Price Elasticity of Demand
- Linear Demand Curve
- Non-Linear Demand Curve
- Factors Influencing the Elasticity of Demand
- Importance of Elasticity of Demand
- Determinants of Price Elasticity of Demand
Supply Analysis
- Concept of Supply
- Concept of Total Output
- Concept of Stock
- Distinguish between Stock and Supply
- Supply Schedule
- Individual Supply Schedule
- Market Supply Schedule
- Determinants of Supply
- Law of Supply
- Variations in Supply
- Changes in Supply
- Cost Concepts > Total Costs
- Cost Concepts > Average Cost
- Cost Concepts > Marginal Cost
- Revenue Concepts
- Total Revenue
- Average Revenue
- Marginal Revenue
Forms of Market
- Concept of Market
- Classification of Market > Based on Place
- Classification of Market > Based on Place
- Classification of Market > Based on Time
- Classification of Market > Based on Competition
- Perfect Competition
- Price Determination Under Perfect Competition
- Imperfect Competition
- Monopoly
- Concept of Monopsony
- Oligopoly
- Monopolistic Competition
Index Numbers
- Index Numbers
- Features of Index Numbers
- Types of Index Numbers
- Index Numbers Used by Government of India
- Significance of Index Numbers
- Rebasing of GDP, IIP, and WPI
- Construction of Index Numbers
- Methods of Constructing Index Numbers > Simple Index Number
- Price Index Number
- Quantity Index Number
- Value Index Number
- Methods of Constructing Index Numbers > Weighted Index Number
- Laaspeyre’s Price Index Number
- Paasche’s Price Index Number
- Concepts of Sensex and Nifty
- Crops in India's Agricultural and Industrial Production Index
- Limitations of Index Numbers
National Income
- Concept of National Income
- Features of National Income
- Circular Flow of National Income
- Two Sector Model of Circular Flow of National Income
- Three Sector Model of Circular Flow of National Income
- Four Sector Model of Circular Income
- Different Concepts of National Income
- Concept of Green GNP
- Methods of Measurement of National Income
- Output Method/Product Method
- Income Method
- Expenditure Method
- Concept of Mixed income
- Difficulties in the Measurement of National Income
- Importance of National Income Analysis
Public Finance in India
- Public Finance
- Difference Between Public Finance and Private Finance
- Structure of Public Finance > Public Expenditure
- Important Social Welfare Schemes by the Government
- Structure of Public Finance > Public Revenue
- Public Revenue > Taxes
- Types of Taxes
- Direct Tax
- Indirect Tax
- Public Revenue > Non-tax Revenue
- Structure of Public Finance > Public Debt
- Structure of Public Finance > Fiscal Policy
- Structure of Public Finance > Financial Administration
- GST(Economics)
- Government Budget
- Revenue and Capital Budgets
- Types of Budget
- Importance of Budget
Money Market and Capital Market in India
- Concept of Financial Market
- Money Market
- Structure of Money Market in India > Organized Sector
- Structure of Money Market in India > Organized Sector
- Reserve Bank of India (RBI)
- Commercial Banks
- Co-operative Banks
- Development Financial Institutions (DFIs)
- Discount and Finance House of India (DFHI)
- Structure of Money Market in India > Unorganized Sector
- Money Market
- Role of Money Market in India
- Problems of the Indian Money Market
- Reforms Introduced in the Money Market
- Recent Developments in Banking Sector
- Capital Market
- Structure of Capital Market in India
- Role of Capital Market in India
- Problems of the Capital Market
- Regional Stock Exchanges in India
- Reforms Introduced in the Capital Market
- Economic Policy in an Economy
Foreign Trade of India
- India’s Trade Relations Before 1947
- Internal Trade
- Foreign Trade of India
- Types of Foreign Trade
- Role of Foreign Trade
- India’s Recent Trade Relations with China and Japan
- Composition of India’s Foreign Trade
- India’s Foreign Trade Share in GNI
- Composition of India's Imports
- Composition of India's Exports
- Direction of India’s Foreign Trade
- Trends in India’s Foreign Trade since 2001
- Concept of Balance of Payments
- Balance of Trade
- Member Nations of OPEC and OECD
CISCE: Class 12
Introduction
The market demand curve shows the total quantity of a product all buyers will buy at each price, assuming everything else stays the same.
CISCE: Class 12
Derivation of Market Demand Curve
1) The market demand curve is made by adding up the quantities demanded by all individuals at each price. This is called horizontal summation.
2) For each price, add the amounts each person wants:
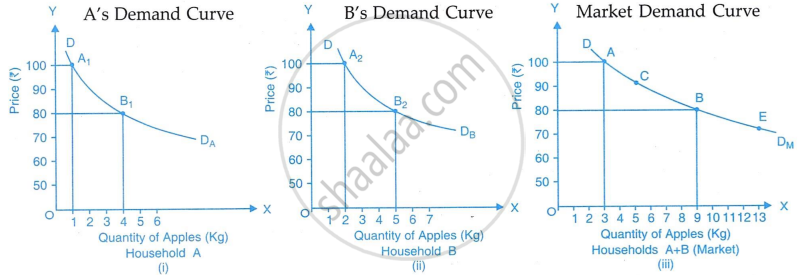
Example:
At ₹100 per kg:
- Household A = 1 kg
- Household B = 2 kg
- Market total = 3 kg (1 + 2)
At ₹80 per kg:
- A = 4 kg
- B = 5 kg
- Market total = 9 kg (4 + 5)
CISCE: Class 12
Real-Life Application
Think of a fruit market. If every family shares how much they’ll buy at each price, and you add everyone’s quantity for each price, you have the market demand—total apples sold at each price.
Maharashtra State Board: Class 12
CISCE: Class 12
CISCE: Class 12
Key Points: Market Demand Curve
- The market demand curve is the sum of all buyers' demands at each price.
- It slopes downwards: lower price → higher quantity demanded.
- Useful for market analysis and price setting.
