Advertisements
Advertisements
Question
Give three hypotheses for explaining why tropics show greatest levels of species richness.
Advertisements
Solution
- Speciation is generally a function of time. Temperate regions have been repeatedly glaciated since ancient times, while tropical latitudes have remained undisturbed for millions of years. Hence, there has been more time for species to evolve and diversify.
- The tropical environment is different from the temperate environment and shows fewer seasonal changes. This stable environment has encouraged niche specialisation, leading to greater species diversity.
- More solar energy is available in tropical regions, which leads to greater productivity and, indirectly, to more extraordinary biodiversity.
APPEARS IN
RELATED QUESTIONS
The following graph shows the species-area relationship. Answer the following questions as directed.
(a) Name the naturalist who studied the kind of relationship shown in the graph. Write the observations made by him.
(b) Write the situations as discovered by the ecologists when the value of ‘Z’
(Slope of the line) lies between:
- 0.1 and 0.2
- 0.6 and 1.2
What does ‘Z’ stand for?
(c) When would the slope of the line ‘b’ become steeper?
Explain, giving three reasons, why tropics show greatest levels of species diversity.
Short answer type question
Tropical regions exhibit species richness as compared to polar regions. Justify.
The 'rivet' in the rivet popper hypothesis is considered to represent the ______.
Extent of global diversity of invertebrates is shown in the pie diagram below. Choose the most appropriate alternative that the four portions (a-d) represent.

Latitudinal and altitudinal gradient is shown by which of the following habitat(s)?
All are true regarding graph showing species richness - area relationship, EXCEPT ______.
Which of the following is an observation of Alexander von Humboldt's documented pattern in ecology?
The graph of species richness and area for a number of taxa like angiospermic plants, freshwater fishes, and birds is found to be ______.
Which of the below mentioned regions exhibit lees seasonal variations?
Which of these is true about tropical environments?
Which of these is true about tropical environments?
"Species richness increased with increased explored area but only a limit". This statement was given by.
Which one of the following is not a major characteristic feature of biodiversity hot spots?
Amongst the animal groups given below, which one appears to be more vulnerable to extinction?
There is greater biodiversity in tropical /subtropical regions than in temperate region. Explain.
The relation between species richness and area for a wide variety of taxa turns out to be a rectangular hyperbola. Give a brief explanation.
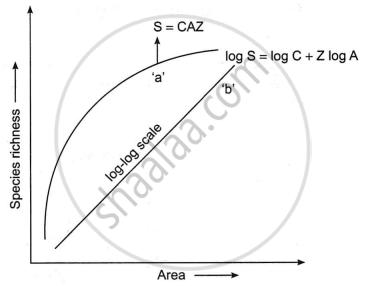
Given below is an equation describing the Species-Area relationship between species richness and area for a wide variety of taxa as angiosperm plants, birds, bats etc. S = CAz
- Give a graphical representation of the given equation showing Species-Area relationship.
- What does 'S' represent in the given equation?
- What is the value of 'Z' (regression coefficient) for frugivorous birds and mammals in the tropical forests of different continents?
Lesser variation in biomass production over a period of time is called ______.
The relation between species richness and area for a wide variety of taxa appears as ______.
Which of the following hypothesis suggests that ecosystems are like aeroplanes where flight safety (ecosystem functioning) may or may not be compromised, depending upon which species are being lost?
When pre-reproductive and post - reproductive age group is same in structure, the population is______.
Match the scientist in column I with their contribution in column II and choose the correct option.
| Column I | Column II | ||
| i. | Alexander Van Humboldt | a. | Estimated 7 million species round the globe |
| ii. | Robert May | b. | Rivet popper hypothesis |
| iii. | David Tillman | c. | Species Area Relationship |
| iv. | Paul Ehrlich | d. | Productivity stability hypothesis |
