Advertisements
Advertisements
Question
The relation between species richness and area for a wide variety of taxa turns out to be a rectangular hyperbola. Give a brief explanation.
Advertisements
Solution
During his pioneering and extensive explorations in the wilderness of South American jungles, the great German naturalist and geographer Alexander von Humboldt observed that within a region species richness increased with the increasing explored area, but only up to a limit. In fact, the relation between species richness and area for a wide variety of taxa (angiosperm plants, birds, bats, freshwater fishes) turns out to be a rectangular hyperbola.
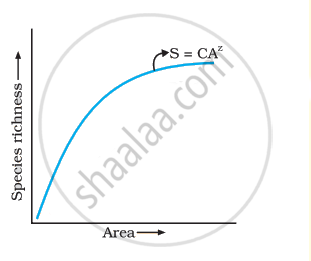
Species area relationship
APPEARS IN
RELATED QUESTIONS
What is the significance of the slope of regression in a species-area relationship?
Short answer type question
Tropical regions exhibit species richness as compared to polar regions. Justify.
The 'rivet' in the rivet popper hypothesis is considered to represent the ______.
In the equation: log S = log C + Z log A , S= species richness; Z = slope of line (regression coefficient); A = area; C = Y intercept. For smaller area, the value of Z ranges from ____________.
Oxygen dissociation curve for Myoglobin has the following shape:
Amongst the animal group given below, which one has the highest percentage of endangered species?
Which of the below mentioned regions exhibit lees seasonal variations?
Which of these is true about tropical environments?
Which of these is true about tropical environments?
Which of the following countries has the highest biodiversity?
Amongst the animal groups given below, which one appears to be more vulnerable to extinction?
Is it possible that productivity and diversity of a natural community remain constant over a time period of, say one hundred years?
Is it true that there is more solar energy available in the tropics? Explain briefly.
Given below is an equation describing the Species-Area relationship between species richness and area for a wide variety of taxa as angiosperm plants, birds, bats etc. S = CAz
- Give a graphical representation of the given equation showing Species-Area relationship.
- What does 'S' represent in the given equation?
- What is the value of 'Z' (regression coefficient) for frugivorous birds and mammals in the tropical forests of different continents?
Write the inference drawn by Alexander von Humboldt after his extensive explorations of South American jungle.
For frugivorous (fruit-eating) birds and mammals in the tropical forests of different continents, the slope of the species-area relationship is found to be approximately ______.
Which of the following hypothesis suggests that ecosystems are like aeroplanes where flight safety (ecosystem functioning) may or may not be compromised, depending upon which species are being lost?
Rivet Popper Hypothesis is an analogy to explain the significance of ______.
Tropical regions show greatest level of species richness because -
- Tropical latitudes have remained relatively undisturbed for millions of years, hence more time was available for species diversification.
- Tropical environments are more seasonal.
- More solar energy is available in tropics.
- Constant environments promote niche specialization.
- Tropical environments are constant and predictable.
Choose the correct answer form the options given below:
