Advertisements
Advertisements
प्रश्न
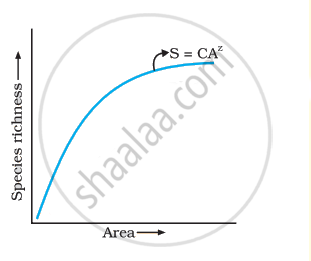
The relation between species richness and area for a wide variety of taxa turns out to be a rectangular hyperbola. Give a brief explanation.
Advertisements
उत्तर
During his pioneering and extensive explorations in the wilderness of South American jungles, the great German naturalist and geographer Alexander von Humboldt observed that within a region species richness increased with the increasing explored area, but only up to a limit. In fact, the relation between species richness and area for a wide variety of taxa (angiosperm plants, birds, bats, freshwater fishes) turns out to be a rectangular hyperbola.
Species area relationship
APPEARS IN
संबंधित प्रश्न
What is the significance of the slope of regression in a species-area relationship?
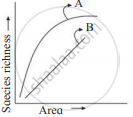
Observe the graph and select the correct option:
The 'rivet' in the rivet popper hypothesis is considered to represent the ______.
Which of the following hypothesis states: Rich species diversity leads to lesser variation in biomass production over a period of time.
Maximum species richness is observed in the ______.
In the equation: log S = log C + Z log A , S= species richness; Z = slope of line (regression coefficient); A = area; C = Y intercept. For smaller area, the value of Z ranges from ____________.
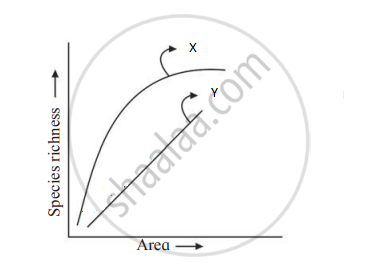
Select the correct alternative for x and y.
Which of these is true about tropical environments?
What does the term ‘Frugivorous’ mean?
There is greater biodiversity in tropical /subtropical regions than in temperate region. Explain.
Species diversity decreases as we move away from the equator towards the poles. What could be the possible reasons?
Given below is an equation describing the Species-Area relationship between species richness and area for a wide variety of taxa as angiosperm plants, birds, bats etc. S = CAz
- Give a graphical representation of the given equation showing Species-Area relationship.
- What does 'S' represent in the given equation?
- What is the value of 'Z' (regression coefficient) for frugivorous birds and mammals in the tropical forests of different continents?
Write the inference drawn by Alexander von Humboldt after his extensive explorations of South American jungle.
The species-area relationship is represented on a log scale as ______.
The relation between species richness and area for a wide variety of taxa appears as ______.
Alexander von Humboldt observed that, within a region species richness ______ with increasing explored area.
Rivet Popper Hypothesis is an analogy to explain the significance of ______.
Tropical regions show greatest level of species richness because -
- Tropical latitudes have remained relatively undisturbed for millions of years, hence more time was available for species diversification.
- Tropical environments are more seasonal.
- More solar energy is available in tropics.
- Constant environments promote niche specialization.
- Tropical environments are constant and predictable.
Choose the correct answer form the options given below:
Which of the following characteristics are seen in a stable community?
- It is strong enough to withstand environmental disturbance and recovers quickly.
- It is resistant to invasive species.
- It exhibits constant change in biomass production over a period of time.
- It has more species diversity.
