Advertisements
Advertisements
प्रश्न
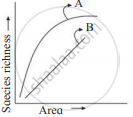
Observe the graph and select the correct option:
पर्याय
Line A represents, S = CA2
Line B represents, log C = log A + Z log S
Line A represents, S = CAZ
Line B represents, log S = log Z + C log A
Advertisements
उत्तर
Line A represents, S = CAZ
Explanation:
The equation S = CAZ often gives the species-area relationship, where S is the number of species, A is the area, and C and Z are constants. The relationship is typically nonlinear.
संबंधित प्रश्न
Extent of global diversity of invertebrates is shown in the pie diagram below. Choose the most appropriate alternative that the four portions (a-d) represent.

On a log scale the relationship of species richness and area becomes linear (straight line) and is given by the equation.
With reference to graph select the correct alternative
All are true regarding graph showing species richness - area relationship, EXCEPT ______.
Species richness - area relationship is given by ______.
Is it possible that productivity and diversity of a natural community remain constant over a time period of, say one hundred years?
There is greater biodiversity in tropical /subtropical regions than in temperate region. Explain.
Given below is an equation describing the Species-Area relationship between species richness and area for a wide variety of taxa as angiosperm plants, birds, bats etc. S = CAz
- Give a graphical representation of the given equation showing Species-Area relationship.
- What does 'S' represent in the given equation?
- What is the value of 'Z' (regression coefficient) for frugivorous birds and mammals in the tropical forests of different continents?
The species-area relationship is represented on a log scale as ______.
For frugivorous (fruit-eating) birds and mammals in the tropical forests of different continents, the slope of the species-area relationship is found to be approximately ______.
