Advertisements
Advertisements
प्रश्न
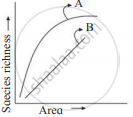
Observe the graph and select the correct option:
विकल्प
Line A represents, S = CA2
Line B represents, log C = log A + Z log S
Line A represents, S = CAZ
Line B represents, log S = log Z + C log A
Advertisements
उत्तर
Line A represents, S = CAZ
Explanation:
The equation S = CAZ often gives the species-area relationship, where S is the number of species, A is the area, and C and Z are constants. The relationship is typically nonlinear.
संबंधित प्रश्न
Maximum species richness is observed in the ______.
In the equation: log S = log C + Z log A , S= species richness; Z = slope of line (regression coefficient); A = area; C = Y intercept. For smaller area, the value of Z ranges from ____________.
Oxygen dissociation curve for Myoglobin has the following shape:
"Species richness increased with increased explored area but only a limit". This statement was given by.
Species diversity decreases as we move away from the equator towards the poles. What could be the possible reasons?
Write the inference drawn by Alexander von Humboldt after his extensive explorations of South American jungle.
The species-area relationship is represented on a log scale as ______.
Distribution of diversity on earth shows that biodiversity from higher latitudes to lower latitudes ______.
Which of the following hypothesis suggests that ecosystems are like aeroplanes where flight safety (ecosystem functioning) may or may not be compromised, depending upon which species are being lost?
Which of the following characteristics are seen in a stable community?
- It is strong enough to withstand environmental disturbance and recovers quickly.
- It is resistant to invasive species.
- It exhibits constant change in biomass production over a period of time.
- It has more species diversity.
