Advertisements
Advertisements
प्रश्न
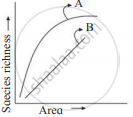
The species-area relationship is represented on a log scale as ______.
विकल्प
inverted
rectangular hyperbola
hyperbola
linear
Advertisements
उत्तर
The species-area relationship is represented on a log scale as a linear.
Explanation:
On a log-log scale, the relationship between species richness (S) and area (A) is given by:
log S = log C + Z log A
This is the equation of a straight line (linear relationship), where:
- Log S is plotted on the y-axis
- Log A is plotted on the x-axis
So, on a logarithmic scale, the relationship is linear.
APPEARS IN
संबंधित प्रश्न
Explain, giving three reasons, why tropics show greatest levels of species diversity.
Observe the graph and select the correct option:
Short answer type question
Tropical regions exhibit species richness as compared to polar regions. Justify.
The graph of species richness and area for a number of taxa like angiospermic plants, freshwater fishes, and birds is found to be ______.
Oxygen dissociation curve for Myoglobin has the following shape:
Which of these is true about tropical environments?
Which of these is true about tropical environments?
The relation between species richness and area for a wide variety of taxa appears as ______.
When pre-reproductive and post - reproductive age group is same in structure, the population is______.
Match the scientist in column I with their contribution in column II and choose the correct option.
| Column I | Column II | ||
| i. | Alexander Van Humboldt | a. | Estimated 7 million species round the globe |
| ii. | Robert May | b. | Rivet popper hypothesis |
| iii. | David Tillman | c. | Species Area Relationship |
| iv. | Paul Ehrlich | d. | Productivity stability hypothesis |
