Advertisements
Advertisements
प्रश्न
The species-area relationship is represented on a log scale as ______.
पर्याय
inverted
rectangular hyperbola
hyperbola
linear
Advertisements
उत्तर
The species-area relationship is represented on a log scale as a linear.
Explanation:
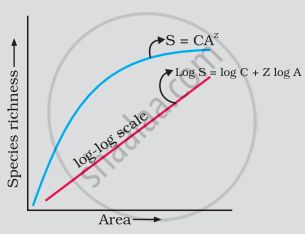
On a log-log scale, the relationship between species richness (S) and area (A) is given by:
log S = log C + Z log A
This is the equation of a straight line (linear relationship), where:
- Log S is plotted on the y-axis
- Log A is plotted on the x-axis
So, on a logarithmic scale, the relationship is linear.
APPEARS IN
संबंधित प्रश्न
Short answer type question
Tropical regions exhibit species richness as compared to polar regions. Justify.
The 'rivet' in the rivet popper hypothesis is considered to represent the ______.
Amongst the animal group given below, which one has the highest percentage of endangered species?
"Species richness increased with increased explored area but only a limit". This statement was given by.
Species diversity decreases as we move away from the equator towards the poles. What could be the possible reasons?
Study the graph given below:
As per Alexander von Humboldt, what do the symbols S, A, Z and C in the graph stand for, in respect of a species and area relationship?
For frugivorous (fruit-eating) birds and mammals in the tropical forests of different continents, the slope of the species-area relationship is found to be approximately ______.
The relation between species richness and area for a wide variety of taxa appears as ______.
Which of the following hypothesis suggests that ecosystems are like aeroplanes where flight safety (ecosystem functioning) may or may not be compromised, depending upon which species are being lost?
When pre-reproductive and post - reproductive age group is same in structure, the population is______.
