Advertisements
Advertisements
प्रश्न
Study the graph given below:
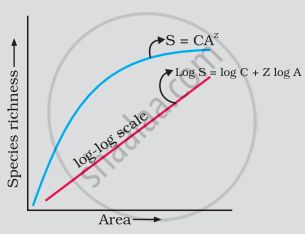
As per Alexander von Humboldt, what do the symbols S, A, Z and C in the graph stand for, in respect of a species and area relationship?
Advertisements
उत्तर
On a logarithmic scale, the relationship is a straight line described by the equation,
log S = log C + Z log A
where,
S = Species richness
A = Area
Z = slope of the line (regression coefficient)
C = Y-intercept
संबंधित प्रश्न
The following graph shows the species-area relationship. Answer the following questions as directed.
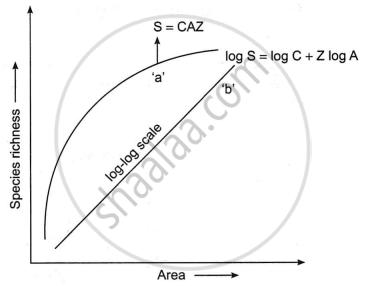
(a) Name the naturalist who studied the kind of relationship shown in the graph. Write the observations made by him.
(b) Write the situations as discovered by the ecologists when the value of ‘Z’
(Slope of the line) lies between:
- 0.1 and 0.2
- 0.6 and 1.2
What does ‘Z’ stand for?
(c) When would the slope of the line ‘b’ become steeper?
Give three hypotheses for explaining why tropics show greatest levels of species richness.
Latitudinal and altitudinal gradient is shown by which of the following habitat(s)?
Oxygen dissociation curve for Myoglobin has the following shape:
Which of these is true about tropical environments?
The pattern of biodiversity is affected by ______.
Which one of the following is not a major characteristic feature of biodiversity hot spots?
Given below is an equation describing the Species-Area relationship between species richness and area for a wide variety of taxa as angiosperm plants, birds, bats etc. S = CAz
- Give a graphical representation of the given equation showing Species-Area relationship.
- What does 'S' represent in the given equation?
- What is the value of 'Z' (regression coefficient) for frugivorous birds and mammals in the tropical forests of different continents?
Distribution of diversity on earth shows that biodiversity from higher latitudes to lower latitudes ______.
Tropical regions show greatest level of species richness because -
- Tropical latitudes have remained relatively undisturbed for millions of years, hence more time was available for species diversification.
- Tropical environments are more seasonal.
- More solar energy is available in tropics.
- Constant environments promote niche specialization.
- Tropical environments are constant and predictable.
Choose the correct answer form the options given below:
