Advertisements
Advertisements
प्रश्न
Given below is an equation describing the Species-Area relationship between species richness and area for a wide variety of taxa as angiosperm plants, birds, bats etc. S = CAz
- Give a graphical representation of the given equation showing Species-Area relationship.
- What does 'S' represent in the given equation?
- What is the value of 'Z' (regression coefficient) for frugivorous birds and mammals in the tropical forests of different continents?
Advertisements
उत्तर
- The given equation's graphical representation of the relationship between species and area is as follows:
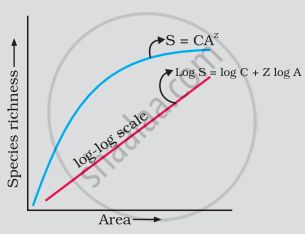
- The species richness is represented by S in the given equation.
- The regression coefficient Z is the slope of the line. The slope is found to be 1.15 for frugivorous (fruit-eating) birds and mammals in tropical woods on various continents.
संबंधित प्रश्न
On a log scale the relationship of species richness and area becomes linear (straight line) and is given by the equation.
In the equation: log S = log C + Z log A , S= species richness; Z = slope of line (regression coefficient); A = area; C = Y intercept. For smaller area, the value of Z ranges from ____________.
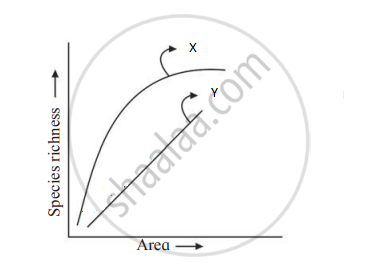
Select the correct alternative for x and y.
Which of the following countries has the highest biodiversity?
Amongst the animal groups given below, which one appears to be more vulnerable to extinction?
Species diversity decreases as we move away from the equator towards the poles. What could be the possible reasons?
Lesser variation in biomass production over a period of time is called ______.
Distribution of diversity on earth shows that biodiversity from higher latitudes to lower latitudes ______.
The relation between species richness and area for a wide variety of taxa appears as ______.
When pre-reproductive and post - reproductive age group is same in structure, the population is______.
