Advertisements
Advertisements
Question
Given below is an equation describing the Species-Area relationship between species richness and area for a wide variety of taxa as angiosperm plants, birds, bats etc. S = CAz
- Give a graphical representation of the given equation showing Species-Area relationship.
- What does 'S' represent in the given equation?
- What is the value of 'Z' (regression coefficient) for frugivorous birds and mammals in the tropical forests of different continents?
Advertisements
Solution
- The given equation's graphical representation of the relationship between species and area is as follows:
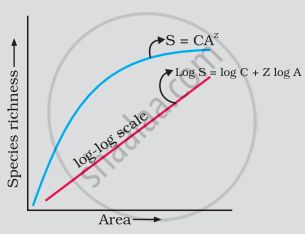
- The species richness is represented by S in the given equation.
- The regression coefficient Z is the slope of the line. The slope is found to be 1.15 for frugivorous (fruit-eating) birds and mammals in tropical woods on various continents.
RELATED QUESTIONS
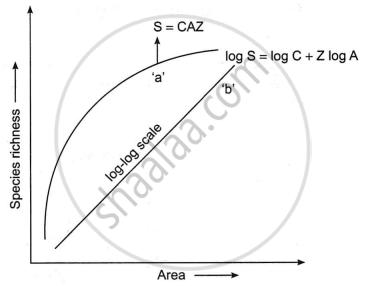
The following graph shows the species-area relationship. Answer the following questions as directed.
(a) Name the naturalist who studied the kind of relationship shown in the graph. Write the observations made by him.
(b) Write the situations as discovered by the ecologists when the value of ‘Z’
(Slope of the line) lies between:
- 0.1 and 0.2
- 0.6 and 1.2
What does ‘Z’ stand for?
(c) When would the slope of the line ‘b’ become steeper?
Explain, giving three reasons, why tropics show greatest levels of species diversity.
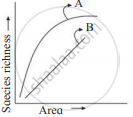
Observe the graph and select the correct option:
Short answer type question
Tropical regions exhibit species richness as compared to polar regions. Justify.
On a log scale the relationship of species richness and area becomes linear (straight line) and is given by the equation.
Maximum species richness is observed in the ______.
The graph of species richness and area for a number of taxa like angiospermic plants, freshwater fishes, and birds is found to be ______.
Which one of the following is not a major characteristic feature of biodiversity hot spots?
What does the term ‘Frugivorous’ mean?
When pre-reproductive and post - reproductive age group is same in structure, the population is______.
