Advertisements
Advertisements
प्रश्न
Given below is an equation describing the Species-Area relationship between species richness and area for a wide variety of taxa as angiosperm plants, birds, bats etc. S = CAz
- Give a graphical representation of the given equation showing Species-Area relationship.
- What does 'S' represent in the given equation?
- What is the value of 'Z' (regression coefficient) for frugivorous birds and mammals in the tropical forests of different continents?
Advertisements
उत्तर
- The given equation's graphical representation of the relationship between species and area is as follows:
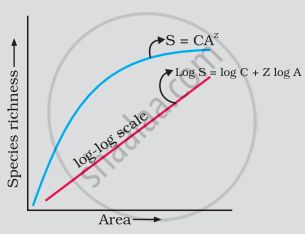
- The species richness is represented by S in the given equation.
- The regression coefficient Z is the slope of the line. The slope is found to be 1.15 for frugivorous (fruit-eating) birds and mammals in tropical woods on various continents.
संबंधित प्रश्न
Observe the graph and select the correct option:
Which of the following hypothesis states: Rich species diversity leads to lesser variation in biomass production over a period of time.
Latitudinal and altitudinal gradient is shown by which of the following habitat(s)?
Species richness - area relationship is given by ______.
"Species richness increased with increased explored area but only a limit". This statement was given by.
Which of the following countries has the highest biodiversity?
There is greater biodiversity in tropical /subtropical regions than in temperate region. Explain.
The species-area relationship is represented on a log scale as ______.
Which of the following hypothesis suggests that ecosystems are like aeroplanes where flight safety (ecosystem functioning) may or may not be compromised, depending upon which species are being lost?
Who observed that within a region, species richness increased with increasing explored area, to a certain limit?
