Advertisements
Advertisements
Question
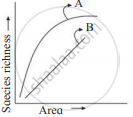
Observe the graph and select the correct option:
Options
Line A represents, S = CA2
Line B represents, log C = log A + Z log S
Line A represents, S = CAZ
Line B represents, log S = log Z + C log A
Advertisements
Solution
Line A represents, S = CAZ
Explanation:
The equation S = CAZ often gives the species-area relationship, where S is the number of species, A is the area, and C and Z are constants. The relationship is typically nonlinear.
RELATED QUESTIONS
Give three hypotheses for explaining why tropics show greatest levels of species richness.
The 'rivet' in the rivet popper hypothesis is considered to represent the ______.
In the equation: log S = log C + Z log A , S= species richness; Z = slope of line (regression coefficient); A = area; C = Y intercept. For smaller area, the value of Z ranges from ____________.
Which one of the following is not a major characteristic feature of biodiversity hot spots?
There is greater biodiversity in tropical /subtropical regions than in temperate region. Explain.
Species diversity decreases as we move away from the equator towards the poles. What could be the possible reasons?
The relation between species richness and area for a wide variety of taxa turns out to be a rectangular hyperbola. Give a brief explanation.
Rivet Popper Hypothesis is an analogy to explain the significance of ______.
When pre-reproductive and post - reproductive age group is same in structure, the population is______.
Tropical regions show greatest level of species richness because -
- Tropical latitudes have remained relatively undisturbed for millions of years, hence more time was available for species diversification.
- Tropical environments are more seasonal.
- More solar energy is available in tropics.
- Constant environments promote niche specialization.
- Tropical environments are constant and predictable.
Choose the correct answer form the options given below:
