Advertisements
Advertisements
Question
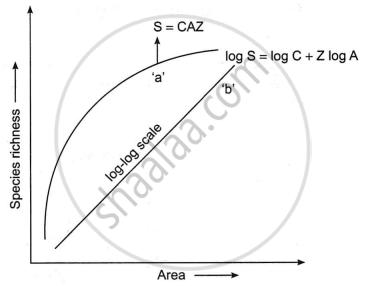
The following graph shows the species-area relationship. Answer the following questions as directed.
(a) Name the naturalist who studied the kind of relationship shown in the graph. Write the observations made by him.
(b) Write the situations as discovered by the ecologists when the value of ‘Z’
(Slope of the line) lies between:
- 0.1 and 0.2
- 0.6 and 1.2
What does ‘Z’ stand for?
(c) When would the slope of the line ‘b’ become steeper?
Advertisements
Solution 1
(a) The German naturalist and geographer Alexander von Humboldt studied the species–area relationship. He found that species richness within a region increased with increasing area but up to a certain limit. The relationship between species richness and area turned out to be rectangular hyperbola for a wide variety of taxa.
(b)
(i) If the value of Z lies in the range of 0.1−0.2, then it is regardless of taxonomic group or region.
(ii) If the value of Z lies in the range of 0.6−1.2, then the slope of the line will be much steeper.
Z stands for the slope of the line or regression coefficient.
(c) If the species–area relationship is for very large areas such as the entire continent, then the slope of the line will be much steeper.
Solution 2
(a) The naturalist who studied this relationship was Alexander von Humboldt. He observed that within a region, species richness increased with increasing explored area, but only up to a limit. When plotted, the relation between species richness and area for various taxa forms a rectangular hyperbola. On a logarithmic scale, this becomes a straight line described by the equation:
log S = log C + Z log A
where,
(S) = species richness,
(A) = area,
(Z) = slope of the line (regression coefficient)
(C) = Y-intercept
(b)
- When (Z) lies between 0.1 and 0.2, ecologists have found this range regardless of the taxonomic group or region when the explored area is limited (smaller areas).
- When (Z) lies between 0.6 and 1.2, it occurs for very large areas such as entire continents, where the slope of the line is much steeper.
‘Z’ stands for the regression coefficient or slope of the line in the species-area relationship.
(c) The slope of the line ‘b’ becomes steeper when the explored area increases, such as when moving from smaller regions to very large regions like continents.
RELATED QUESTIONS
What is the significance of the slope of regression in a species-area relationship?
Which of the following hypothesis states: Rich species diversity leads to lesser variation in biomass production over a period of time.
Oxygen dissociation curve for Myoglobin has the following shape:
Which of these is true about tropical environments?
Which of these is true about tropical environments?
Is it possible that productivity and diversity of a natural community remain constant over a time period of, say one hundred years?
Species diversity decreases as we move away from the equator towards the poles. What could be the possible reasons?
The species-area relationship is represented on a log scale as ______.
Who observed that within a region, species richness increased with increasing explored area, to a certain limit?
When pre-reproductive and post - reproductive age group is same in structure, the population is______.
