Advertisements
Advertisements
Question
Is it possible that productivity and diversity of a natural community remain constant over a time period of, say one hundred years?
Advertisements
Solution
No, it is not possible that productivity of a natural community remain constant over a certain time period.
This is because
- The natural habitat is never maintained in real.
- Abundant resources are never available, they are always in short supply or just enough.
- Environment conditions for survival and reproduction are continuously changing.
APPEARS IN
RELATED QUESTIONS
Give three hypotheses for explaining why tropics show greatest levels of species richness.
The 'rivet' in the rivet popper hypothesis is considered to represent the ______.
Extent of global diversity of invertebrates is shown in the pie diagram below. Choose the most appropriate alternative that the four portions (a-d) represent.

Which of the following hypothesis states: Rich species diversity leads to lesser variation in biomass production over a period of time.
All are true regarding graph showing species richness - area relationship, EXCEPT ______.
Which of the following is an observation of Alexander von Humboldt's documented pattern in ecology?
The graph of species richness and area for a number of taxa like angiospermic plants, freshwater fishes, and birds is found to be ______.
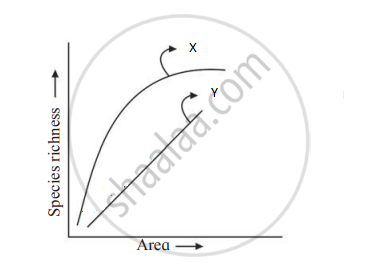
Select the correct alternative for x and y.
"Species richness increased with increased explored area but only a limit". This statement was given by.
Which one of the following is not a major characteristic feature of biodiversity hot spots?
Species diversity decreases as we move away from the equator towards the poles. What could be the possible reasons?
Study the graph given below:
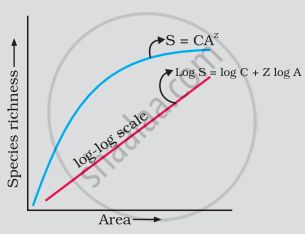
As per Alexander von Humboldt, what do the symbols S, A, Z and C in the graph stand for, in respect of a species and area relationship?
Distribution of diversity on earth shows that biodiversity from higher latitudes to lower latitudes ______.
For frugivorous (fruit-eating) birds and mammals in the tropical forests of different continents, the slope of the species-area relationship is found to be approximately ______.
Alexander von Humboldt observed that, within a region species richness ______ with increasing explored area.
Who observed that within a region, species richness increased with increasing explored area, to a certain limit?
Tropical regions show greatest level of species richness because -
- Tropical latitudes have remained relatively undisturbed for millions of years, hence more time was available for species diversification.
- Tropical environments are more seasonal.
- More solar energy is available in tropics.
- Constant environments promote niche specialization.
- Tropical environments are constant and predictable.
Choose the correct answer form the options given below:
Match the scientist in column I with their contribution in column II and choose the correct option.
| Column I | Column II | ||
| i. | Alexander Van Humboldt | a. | Estimated 7 million species round the globe |
| ii. | Robert May | b. | Rivet popper hypothesis |
| iii. | David Tillman | c. | Species Area Relationship |
| iv. | Paul Ehrlich | d. | Productivity stability hypothesis |
Which of the following characteristics are seen in a stable community?
- It is strong enough to withstand environmental disturbance and recovers quickly.
- It is resistant to invasive species.
- It exhibits constant change in biomass production over a period of time.
- It has more species diversity.
