Advertisements
Advertisements
Question
A species-area curve is drawn by plotting the number of species against the area. How is it that when a very large area is considered the slope is steeper than that for smaller areas?
Advertisements
Solution
Ecologists have discovered that the value of Z (slope of the line) lies in the range of 0.1 to 0.2, regardless of the taxonomic group or the region (whether it is the plants in Britain, birds in California or molluscs in New York state, the slopes of the regression line are amazingly similar). But, if you analyse the species-area relationships among very large areas like the entire continents, you will find that the slope of the line is much steeper (Z values in the range of 0.6 to 1.2). For example, for frugivorous (fruit-eating) birds and mammals in the tropical forests of different continents, the slope is found to be 1.15.
APPEARS IN
RELATED QUESTIONS
The following graph shows the species-area relationship. Answer the following questions as directed.
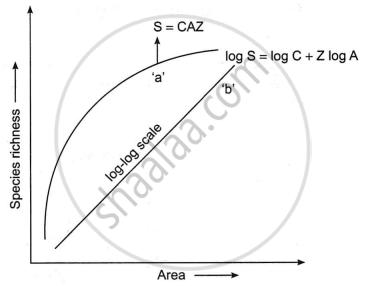
(a) Name the naturalist who studied the kind of relationship shown in the graph. Write the observations made by him.
(b) Write the situations as discovered by the ecologists when the value of ‘Z’
(Slope of the line) lies between:
- 0.1 and 0.2
- 0.6 and 1.2
What does ‘Z’ stand for?
(c) When would the slope of the line ‘b’ become steeper?
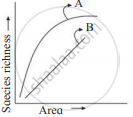
Observe the graph and select the correct option:
Short answer type question
Tropical regions exhibit species richness as compared to polar regions. Justify.
The 'rivet' in the rivet popper hypothesis is considered to represent the ______.
On a log scale the relationship of species richness and area becomes linear (straight line) and is given by the equation.
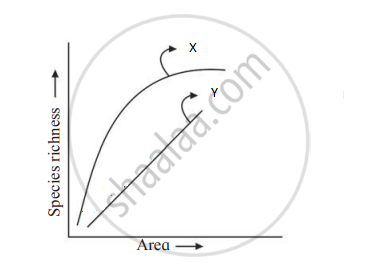
Select the correct alternative for x and y.
Amongst the animal group given below, which one has the highest percentage of endangered species?
Which of the below mentioned regions exhibit lees seasonal variations?
Which of these is true about tropical environments?
The pattern of biodiversity is affected by ______.
Amongst the animal groups given below, which one appears to be more vulnerable to extinction?
There is greater biodiversity in tropical /subtropical regions than in temperate region. Explain.
The relation between species richness and area for a wide variety of taxa turns out to be a rectangular hyperbola. Give a brief explanation.
Lesser variation in biomass production over a period of time is called ______.
Which of the following hypothesis suggests that ecosystems are like aeroplanes where flight safety (ecosystem functioning) may or may not be compromised, depending upon which species are being lost?
Alexander von Humboldt observed that, within a region species richness ______ with increasing explored area.
Which of the following characteristics are seen in a stable community?
- It is strong enough to withstand environmental disturbance and recovers quickly.
- It is resistant to invasive species.
- It exhibits constant change in biomass production over a period of time.
- It has more species diversity.
