Advertisements
Advertisements
प्रश्न
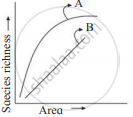
A species-area curve is drawn by plotting the number of species against the area. How is it that when a very large area is considered the slope is steeper than that for smaller areas?
Advertisements
उत्तर
Ecologists have discovered that the value of Z (slope of the line) lies in the range of 0.1 to 0.2, regardless of the taxonomic group or the region (whether it is the plants in Britain, birds in California or molluscs in New York state, the slopes of the regression line are amazingly similar). But, if you analyse the species-area relationships among very large areas like the entire continents, you will find that the slope of the line is much steeper (Z values in the range of 0.6 to 1.2). For example, for frugivorous (fruit-eating) birds and mammals in the tropical forests of different continents, the slope is found to be 1.15.
APPEARS IN
संबंधित प्रश्न
Explain, giving three reasons, why tropics show greatest levels of species diversity.
Observe the graph and select the correct option:
The 'rivet' in the rivet popper hypothesis is considered to represent the ______.
Maximum species richness is observed in the ______.
Which of the following is an observation of Alexander von Humboldt's documented pattern in ecology?
Species richness - area relationship is given by ______.
Oxygen dissociation curve for Myoglobin has the following shape:
Amongst the animal group given below, which one has the highest percentage of endangered species?
Which of these is true about tropical environments?
Which of the following countries has the highest biodiversity?
Which one of the following is not a major characteristic feature of biodiversity hot spots?
Amongst the animal groups given below, which one appears to be more vulnerable to extinction?
What does the term ‘Frugivorous’ mean?
Is it true that there is more solar energy available in the tropics? Explain briefly.
Distribution of diversity on earth shows that biodiversity from higher latitudes to lower latitudes ______.
For frugivorous (fruit-eating) birds and mammals in the tropical forests of different continents, the slope of the species-area relationship is found to be approximately ______.
Alexander von Humboldt observed that, within a region species richness ______ with increasing explored area.
Rivet Popper Hypothesis is an analogy to explain the significance of ______.
