Advertisements
Advertisements
प्रश्न
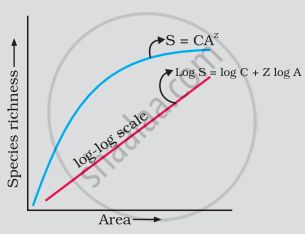
A species-area curve is drawn by plotting the number of species against the area. How is it that when a very large area is considered the slope is steeper than that for smaller areas?
Advertisements
उत्तर
Ecologists have discovered that the value of Z (slope of the line) lies in the range of 0.1 to 0.2, regardless of the taxonomic group or the region (whether it is the plants in Britain, birds in California or molluscs in New York state, the slopes of the regression line are amazingly similar). But, if you analyse the species-area relationships among very large areas like the entire continents, you will find that the slope of the line is much steeper (Z values in the range of 0.6 to 1.2). For example, for frugivorous (fruit-eating) birds and mammals in the tropical forests of different continents, the slope is found to be 1.15.
APPEARS IN
संबंधित प्रश्न
What is the significance of the slope of regression in a species-area relationship?
Short answer type question
Tropical regions exhibit species richness as compared to polar regions. Justify.
The 'rivet' in the rivet popper hypothesis is considered to represent the ______.
Latitudinal and altitudinal gradient is shown by which of the following habitat(s)?
Maximum species richness is observed in the ______.
In the equation: log S = log C + Z log A , S= species richness; Z = slope of line (regression coefficient); A = area; C = Y intercept. For smaller area, the value of Z ranges from ____________.
With reference to graph select the correct alternative
Which of the following is an observation of Alexander von Humboldt's documented pattern in ecology?
Which one of the following is not a major characteristic feature of biodiversity hot spots?
What does the term ‘Frugivorous’ mean?
Is it true that there is more solar energy available in the tropics? Explain briefly.
Write the inference drawn by Alexander von Humboldt after his extensive explorations of South American jungle.
Study the graph given below:
As per Alexander von Humboldt, what do the symbols S, A, Z and C in the graph stand for, in respect of a species and area relationship?
Which of the following hypothesis suggests that ecosystems are like aeroplanes where flight safety (ecosystem functioning) may or may not be compromised, depending upon which species are being lost?
Rivet Popper Hypothesis is an analogy to explain the significance of ______.
When pre-reproductive and post - reproductive age group is same in structure, the population is______.
Tropical regions show greatest level of species richness because -
- Tropical latitudes have remained relatively undisturbed for millions of years, hence more time was available for species diversification.
- Tropical environments are more seasonal.
- More solar energy is available in tropics.
- Constant environments promote niche specialization.
- Tropical environments are constant and predictable.
Choose the correct answer form the options given below:
Which of the following characteristics are seen in a stable community?
- It is strong enough to withstand environmental disturbance and recovers quickly.
- It is resistant to invasive species.
- It exhibits constant change in biomass production over a period of time.
- It has more species diversity.
