Advertisements
Advertisements
प्रश्न
Study the graph given below:
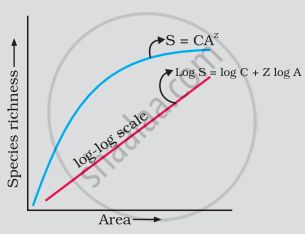
As per Alexander von Humboldt, what do the symbols S, A, Z and C in the graph stand for, in respect of a species and area relationship?
Advertisements
उत्तर
On a logarithmic scale, the relationship is a straight line described by the equation,
log S = log C + Z log A
where,
S = Species richness
A = Area
Z = slope of the line (regression coefficient)
C = Y-intercept
संबंधित प्रश्न
What is the significance of the slope of regression in a species-area relationship?
Short answer type question
Tropical regions exhibit species richness as compared to polar regions. Justify.
Which of the following hypothesis states: Rich species diversity leads to lesser variation in biomass production over a period of time.
Which of these is true about tropical environments?
Amongst the animal groups given below, which one appears to be more vulnerable to extinction?
Is it possible that productivity and diversity of a natural community remain constant over a time period of, say one hundred years?
Given below is an equation describing the Species-Area relationship between species richness and area for a wide variety of taxa as angiosperm plants, birds, bats etc. S = CAz
- Give a graphical representation of the given equation showing Species-Area relationship.
- What does 'S' represent in the given equation?
- What is the value of 'Z' (regression coefficient) for frugivorous birds and mammals in the tropical forests of different continents?
The species-area relationship is represented on a log scale as ______.
Rivet Popper Hypothesis is an analogy to explain the significance of ______.
Which of the following characteristics are seen in a stable community?
- It is strong enough to withstand environmental disturbance and recovers quickly.
- It is resistant to invasive species.
- It exhibits constant change in biomass production over a period of time.
- It has more species diversity.
