Advertisements
Advertisements
प्रश्न
Write the inference drawn by Alexander von Humboldt after his extensive explorations of South American jungle.
Advertisements
उत्तर
Alexander von Humboldt observed that within a region species richness increased with increasing explored area, but only up to a limit. In fact, the relation between species richness and area for a wide variety of taxa (angiosperm plants, birds, bats, freshwater fishes) turns out to be a rectangular hyperbola.
संबंधित प्रश्न
Give three hypotheses for explaining why tropics show greatest levels of species richness.
Observe the graph and select the correct option:
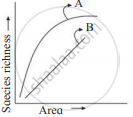
Select the correct alternative for x and y.
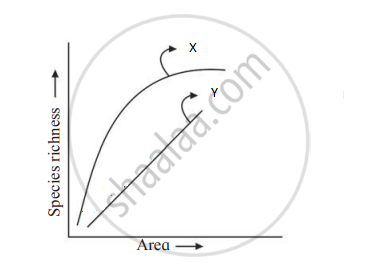
Which of these is true about tropical environments?
Which of these is true about tropical environments?
Given below is an equation describing the Species-Area relationship between species richness and area for a wide variety of taxa as angiosperm plants, birds, bats etc. S = CAz
- Give a graphical representation of the given equation showing Species-Area relationship.
- What does 'S' represent in the given equation?
- What is the value of 'Z' (regression coefficient) for frugivorous birds and mammals in the tropical forests of different continents?
The species-area relationship is represented on a log scale as ______.
Who observed that within a region, species richness increased with increasing explored area, to a certain limit?
Tropical regions show greatest level of species richness because -
- Tropical latitudes have remained relatively undisturbed for millions of years, hence more time was available for species diversification.
- Tropical environments are more seasonal.
- More solar energy is available in tropics.
- Constant environments promote niche specialization.
- Tropical environments are constant and predictable.
Choose the correct answer form the options given below:
Which of the following characteristics are seen in a stable community?
- It is strong enough to withstand environmental disturbance and recovers quickly.
- It is resistant to invasive species.
- It exhibits constant change in biomass production over a period of time.
- It has more species diversity.
