Advertisements
Advertisements
Question
Study the graph given below:
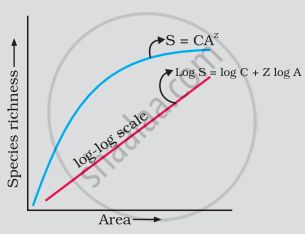
As per Alexander von Humboldt, what do the symbols S, A, Z and C in the graph stand for, in respect of a species and area relationship?
Advertisements
Solution
On a logarithmic scale, the relationship is a straight line described by the equation,
log S = log C + Z log A
where,
S = Species richness
A = Area
Z = slope of the line (regression coefficient)
C = Y-intercept
RELATED QUESTIONS
Give three hypotheses for explaining why tropics show greatest levels of species richness.
Which of the following is an observation of Alexander von Humboldt's documented pattern in ecology?
Oxygen dissociation curve for Myoglobin has the following shape:
What does the term ‘Frugivorous’ mean?
Given below is an equation describing the Species-Area relationship between species richness and area for a wide variety of taxa as angiosperm plants, birds, bats etc. S = CAz
- Give a graphical representation of the given equation showing Species-Area relationship.
- What does 'S' represent in the given equation?
- What is the value of 'Z' (regression coefficient) for frugivorous birds and mammals in the tropical forests of different continents?
The species-area relationship is represented on a log scale as ______.
The relation between species richness and area for a wide variety of taxa appears as ______.
When pre-reproductive and post - reproductive age group is same in structure, the population is______.
Tropical regions show greatest level of species richness because -
- Tropical latitudes have remained relatively undisturbed for millions of years, hence more time was available for species diversification.
- Tropical environments are more seasonal.
- More solar energy is available in tropics.
- Constant environments promote niche specialization.
- Tropical environments are constant and predictable.
Choose the correct answer form the options given below:
Which of the following characteristics are seen in a stable community?
- It is strong enough to withstand environmental disturbance and recovers quickly.
- It is resistant to invasive species.
- It exhibits constant change in biomass production over a period of time.
- It has more species diversity.
