Advertisements
Advertisements
Question
Amongst the animal groups given below, which one appears to be more vulnerable to extinction?
Options
Insects
Mammals
Amphibians
Reptiles
Advertisements
Solution
Amphibians
Explanation:
About 32 percent of amphibian species are at risk due to factors like habitat loss, pollution, and environmental changes. This vulnerability is higher compared to insects, reptiles, and mammals. The decline is largely caused by habitat destruction, environmental sensitivity, and other human-induced factors, making amphibians one of the most threatened groups in biodiversity conservation efforts.
APPEARS IN
RELATED QUESTIONS
Explain, giving three reasons, why tropics show greatest levels of species diversity.
What is the significance of the slope of regression in a species-area relationship?
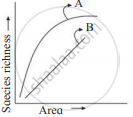
Observe the graph and select the correct option:
Which of the following hypothesis states: Rich species diversity leads to lesser variation in biomass production over a period of time.
Latitudinal and altitudinal gradient is shown by which of the following habitat(s)?
On a log scale the relationship of species richness and area becomes linear (straight line) and is given by the equation.
Maximum species richness is observed in the ______.
In the equation: log S = log C + Z log A , S= species richness; Z = slope of line (regression coefficient); A = area; C = Y intercept. For smaller area, the value of Z ranges from ____________.
Which of the following is an observation of Alexander von Humboldt's documented pattern in ecology?
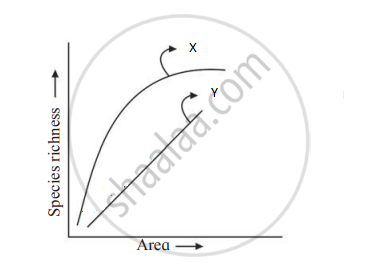
Select the correct alternative for x and y.
Which of the below mentioned regions exhibit lees seasonal variations?
Which of these is true about tropical environments?
"Species richness increased with increased explored area but only a limit". This statement was given by.
Which one of the following is not a major characteristic feature of biodiversity hot spots?
Is it possible that productivity and diversity of a natural community remain constant over a time period of, say one hundred years?
Is it true that there is more solar energy available in the tropics? Explain briefly.
The relation between species richness and area for a wide variety of taxa turns out to be a rectangular hyperbola. Give a brief explanation.
Given below is an equation describing the Species-Area relationship between species richness and area for a wide variety of taxa as angiosperm plants, birds, bats etc. S = CAz
- Give a graphical representation of the given equation showing Species-Area relationship.
- What does 'S' represent in the given equation?
- What is the value of 'Z' (regression coefficient) for frugivorous birds and mammals in the tropical forests of different continents?
Study the graph given below:
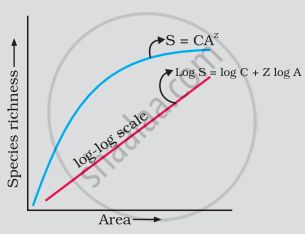
As per Alexander von Humboldt, what do the symbols S, A, Z and C in the graph stand for, in respect of a species and area relationship?
Lesser variation in biomass production over a period of time is called ______.
For frugivorous (fruit-eating) birds and mammals in the tropical forests of different continents, the slope of the species-area relationship is found to be approximately ______.
Which of the following hypothesis suggests that ecosystems are like aeroplanes where flight safety (ecosystem functioning) may or may not be compromised, depending upon which species are being lost?
Who observed that within a region, species richness increased with increasing explored area, to a certain limit?
Which of the following characteristics are seen in a stable community?
- It is strong enough to withstand environmental disturbance and recovers quickly.
- It is resistant to invasive species.
- It exhibits constant change in biomass production over a period of time.
- It has more species diversity.
