Advertisements
Advertisements
प्रश्न
Give three hypotheses for explaining why tropics show greatest levels of species richness.
Advertisements
उत्तर
- Speciation is generally a function of time. Temperate regions have been repeatedly glaciated since ancient times, while tropical latitudes have remained undisturbed for millions of years. Hence, there has been more time for species to evolve and diversify.
- The tropical environment is different from the temperate environment and shows fewer seasonal changes. This stable environment has encouraged niche specialisation, leading to greater species diversity.
- More solar energy is available in tropical regions, which leads to greater productivity and, indirectly, to more extraordinary biodiversity.
APPEARS IN
संबंधित प्रश्न
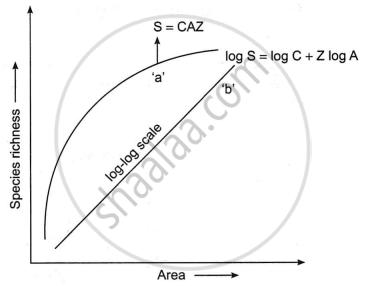
The following graph shows the species-area relationship. Answer the following questions as directed.
(a) Name the naturalist who studied the kind of relationship shown in the graph. Write the observations made by him.
(b) Write the situations as discovered by the ecologists when the value of ‘Z’
(Slope of the line) lies between:
- 0.1 and 0.2
- 0.6 and 1.2
What does ‘Z’ stand for?
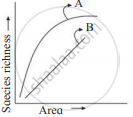
(c) When would the slope of the line ‘b’ become steeper?
Explain, giving three reasons, why tropics show greatest levels of species diversity.
Observe the graph and select the correct option:
In the equation: log S = log C + Z log A , S= species richness; Z = slope of line (regression coefficient); A = area; C = Y intercept. For smaller area, the value of Z ranges from ____________.
With reference to graph select the correct alternative
All are true regarding graph showing species richness - area relationship, EXCEPT ______.
Species richness - area relationship is given by ______.
Oxygen dissociation curve for Myoglobin has the following shape:
Which of these is true about tropical environments?
"Species richness increased with increased explored area but only a limit". This statement was given by.
Which of the following countries has the highest biodiversity?
Which one of the following is not a major characteristic feature of biodiversity hot spots?
Amongst the animal groups given below, which one appears to be more vulnerable to extinction?
What does the term ‘Frugivorous’ mean?
Is it possible that productivity and diversity of a natural community remain constant over a time period of, say one hundred years?
The relation between species richness and area for a wide variety of taxa turns out to be a rectangular hyperbola. Give a brief explanation.
Given below is an equation describing the Species-Area relationship between species richness and area for a wide variety of taxa as angiosperm plants, birds, bats etc. S = CAz
- Give a graphical representation of the given equation showing Species-Area relationship.
- What does 'S' represent in the given equation?
- What is the value of 'Z' (regression coefficient) for frugivorous birds and mammals in the tropical forests of different continents?
Write the inference drawn by Alexander von Humboldt after his extensive explorations of South American jungle.
Distribution of diversity on earth shows that biodiversity from higher latitudes to lower latitudes ______.
For frugivorous (fruit-eating) birds and mammals in the tropical forests of different continents, the slope of the species-area relationship is found to be approximately ______.
Who observed that within a region, species richness increased with increasing explored area, to a certain limit?
When pre-reproductive and post - reproductive age group is same in structure, the population is______.
Match the scientist in column I with their contribution in column II and choose the correct option.
| Column I | Column II | ||
| i. | Alexander Van Humboldt | a. | Estimated 7 million species round the globe |
| ii. | Robert May | b. | Rivet popper hypothesis |
| iii. | David Tillman | c. | Species Area Relationship |
| iv. | Paul Ehrlich | d. | Productivity stability hypothesis |
Which of the following characteristics are seen in a stable community?
- It is strong enough to withstand environmental disturbance and recovers quickly.
- It is resistant to invasive species.
- It exhibits constant change in biomass production over a period of time.
- It has more species diversity.
