Advertisements
Advertisements
प्रश्न
The relation between species richness and area for a wide variety of taxa turns out to be a rectangular hyperbola. Give a brief explanation.
Advertisements
उत्तर
During his pioneering and extensive explorations in the wilderness of South American jungles, the great German naturalist and geographer Alexander von Humboldt observed that within a region species richness increased with the increasing explored area, but only up to a limit. In fact, the relation between species richness and area for a wide variety of taxa (angiosperm plants, birds, bats, freshwater fishes) turns out to be a rectangular hyperbola.
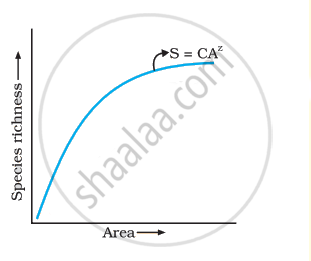
Species area relationship
APPEARS IN
संबंधित प्रश्न
Explain, giving three reasons, why tropics show greatest levels of species diversity.
What is the significance of the slope of regression in a species-area relationship?
Observe the graph and select the correct option:
Extent of global diversity of invertebrates is shown in the pie diagram below. Choose the most appropriate alternative that the four portions (a-d) represent.

Latitudinal and altitudinal gradient is shown by which of the following habitat(s)?
On a log scale the relationship of species richness and area becomes linear (straight line) and is given by the equation.
Maximum species richness is observed in the ______.
With reference to graph select the correct alternative
All are true regarding graph showing species richness - area relationship, EXCEPT ______.
The graph of species richness and area for a number of taxa like angiospermic plants, freshwater fishes, and birds is found to be ______.
Which of these is true about tropical environments?
The pattern of biodiversity is affected by ______.
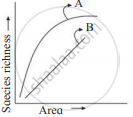
A species-area curve is drawn by plotting the number of species against the area. How is it that when a very large area is considered the slope is steeper than that for smaller areas?
There is greater biodiversity in tropical /subtropical regions than in temperate region. Explain.
Is it true that there is more solar energy available in the tropics? Explain briefly.
Alexander von Humboldt observed that, within a region species richness ______ with increasing explored area.
When pre-reproductive and post - reproductive age group is same in structure, the population is______.
Match the scientist in column I with their contribution in column II and choose the correct option.
| Column I | Column II | ||
| i. | Alexander Van Humboldt | a. | Estimated 7 million species round the globe |
| ii. | Robert May | b. | Rivet popper hypothesis |
| iii. | David Tillman | c. | Species Area Relationship |
| iv. | Paul Ehrlich | d. | Productivity stability hypothesis |
