Advertisements
Advertisements
Question
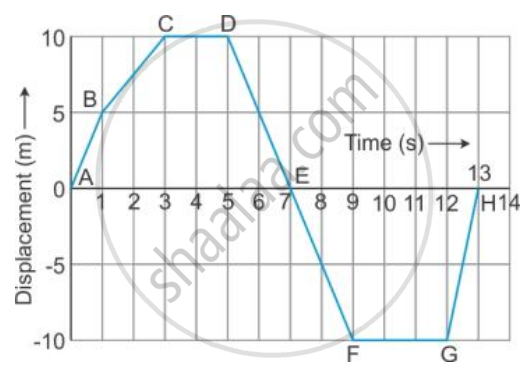
From the displacement-time graph of a cyclist given below in the Figure, find The time after which he reaches the starting point .
Advertisements
Solution
The starting point is where displacement = 0 m.
Looking at the graph:
The cyclist starts at point A (0 m at 0 s).
He returns to 0 m at point E at 7 s.
Again, he crosses 0 m at point H at 13 s.
The cyclist reaches the starting point (displacement = 0) at 7 seconds and 13 seconds.
So the first time he returns to the starting point is 7 seconds later.
APPEARS IN
RELATED QUESTIONS
Show by using the graphical method that: `s=ut+1/2at^2` where the symbols have their usual meanings.
Diagram shows a velocity – time graph for a car starting from rest. The graph has three sections AB, BC and CD.
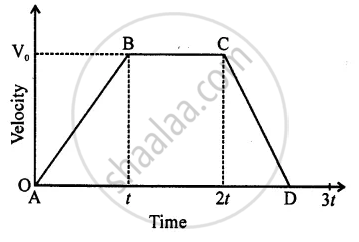
From a study of this graph, state how the distance travelled in any section is determined.
Diagram shows a velocity – time graph for a car starting from rest. The graph has three sections AB, BC, and CD.
Is the magnitude of acceleration higher or lower than that of retardation? Give a reason.
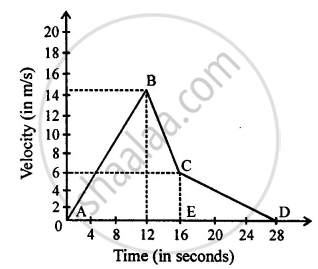
From the velocity – time graph given below, calculate Average velocity in region CED.
What can you conclude if the speed-time graph of a body is a straight line sloping upwards and not passing through the origin?
Interpret the following graph: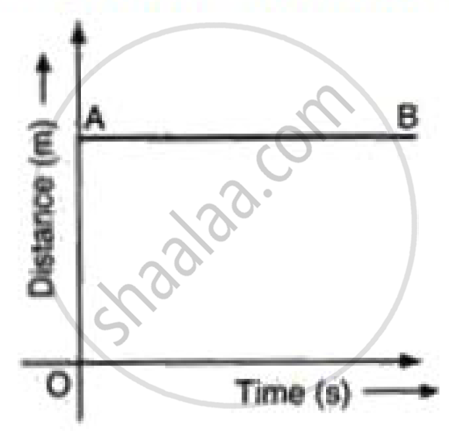
Figure shows the velocity-time graphs for two objects A and B moving in same direction . Which object has the greater a cceleration?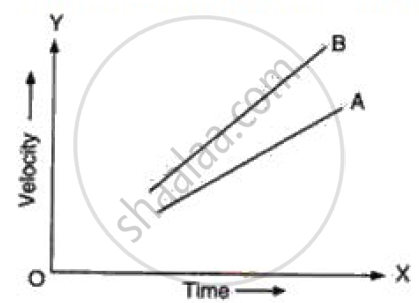
Sketch the shape of the velocity-time graph for a body moving with:
Uniformly velocity
Derive the equation
S = ut+ `1/2` at2
Using a speed- time graph
Slope of the velocity-time graph gives ______.
