Advertisements
Advertisements
Question
How does the slope of a speed-time graph give the acceleration of a body moving along a straight line?
Advertisements
Solution
Slope of a graph is given as rate of change of y coordinates to the x coordinate. In speed time graph speed is on the y axis and time is on the x axis. And we define acceleration as rate of change of speed with respect to time. So slope of a speed time graph gives acceleration.
APPEARS IN
RELATED QUESTIONS
What can you say about the motion of a body if its speed-time graph is a straight line parallel to the time axis ?
Derive the following equation of motion by the graphical method : v2 = u2 + 2as, where the symbols have their usual meanings.
Three speed-time graphs are given below :
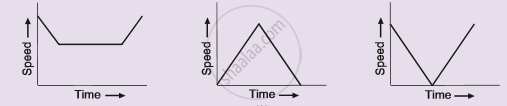
Which graph represents the case of:
(i) a cricket ball thrown vertically upwards and returning to the hands of the thrower ?
(ii) a trolley decelerating to a constant speed and then accelerating uniformly ?
Draw a velocity-time graph for the free fall of a body under gravity starting from rest. Take g = 10m s-2
Represent the position of a body described as at 15 m, 30o north of west, on a graph paper.
The area under a speed-time graph in a given intervals gives the total distance covered by a body irrespective of its motion being uniform or non-uniform.
Given on th e side are a few speed - time graphs for various objects moving along a stra ight line. Refer below figure. (a), (b), (c) and (d).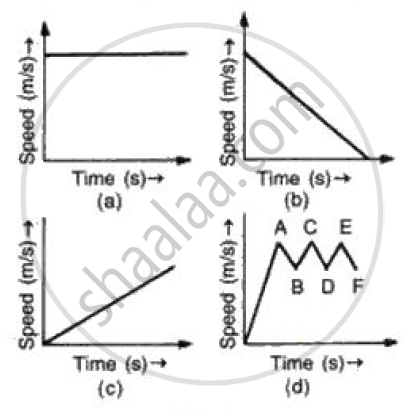
Which of these graphs represent
(a) Uni form motion
(b) Motion with speed increasing
(c) Motion with speed decreasing and
(d) Motion with speed oscillating.?
What can you conclude if the speed-time graph of a body is a curve moving upwards starting from the origin?
Its time-displacement graph is a straight line.
Slope of the velocity-time graph gives ______.
