Advertisements
Advertisements
Question
Derive the following equation of motion by the graphical method : v2 = u2 + 2as, where the symbols have their usual meanings.
Advertisements
Solution
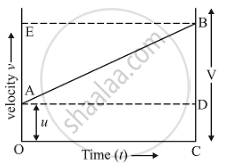
In the given figure, the distance travelled (s) by a body in time (t) is given by the area of the figure OABC which is a trapezium.
Distance travelld = Area of the trapezium OABC
So, Area of trapezium OABC,
= `"(Sum of parallel sides)(Height)"/2`
=`"(OA+CB)(OC)"/2`
Now, (OA + CB) = u + v and (OC) = t.
Putting these values in the above relation, we get:
`s = ((u+v)/2)t` ....(1)
Eliminate t from the above equation. This can be done by obtaining the value of t from the first equation of motion.
v = u + at
So,
`t = "v-u"/a`
Now, put this value of t in equation (1), we get:
`s = (((u+v)(v-u))/(2a))`
On further simplification,
2as = v2 – u2
Finally the third equation of motion.
`v^2 = u^2 + 2as`
where
(s) - Displacement
(u) - Initial velocity
(a) - Acceleration
(v) - Final velocity
(t) - Time taken
APPEARS IN
RELATED QUESTIONS
Fill in the following blank with suitable word :
In a speed-time graph, the area enclosed by the speed-time curve and the time axis gives the…………….. by the body.
What does the area of an acceleration – time graph represent?
Multiple choice Question. Select the correct option.
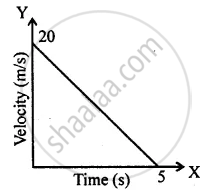
The distance covered in the adjoining velocity-time graph is :
From the velocity – time graph given below, calculate acceleration in the region AB.

Given on th e side are a few speed - time graphs for various objects moving along a stra ight line. Refer below figure. (a), (b), (c) and (d).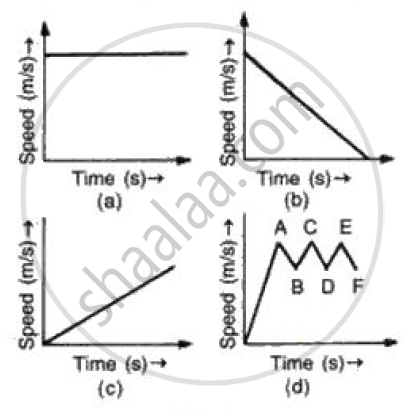
Which of these graphs represent
(a) Uni form motion
(b) Motion with speed increasing
(c) Motion with speed decreasing and
(d) Motion with speed oscillating.?
Draw the following graph:
Speed versus time for a uniformly retarded motion.
What does the slope of speed-time graph indicate?
Draw distance-time graph to show:
Increasing velocity
Figure shows the velocity-time graphs for two objects A and B moving in same direction . Which object has the greater a cceleration?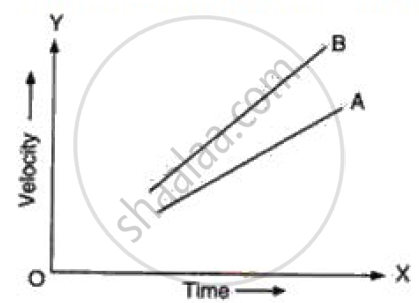
From the v-t graph, ______ can be calculated.
