Advertisements
Advertisements
Question
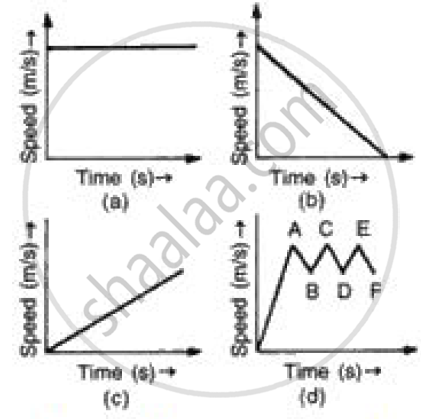
(i) In speed time graph uniform motion is given by a straight line parallel to x axis so figure (a) denotes the uniform motion.
(ii) In speed time graph motion with increasing speed is shown by straight line with positive slope so figure (c) denotes the motion with speed increasing.
(iii) In speed time graph motion with decreasing speed is shown by straight line with negative slope so figure (b) denotes the motion with speed decreasing.
(iv) In speed time graph motion with oscillating speed is shown by zigzag line so figure {d) denotes the motion with speed oscillating.
Advertisements
Solution
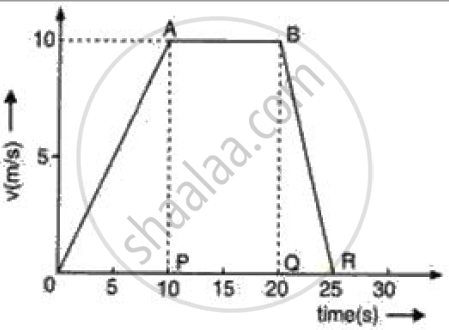
As we know that acceleration is given by the slope of the velocity-time graph so we have to calculate the slope of the graph of each stage of motion,
Acceleration during O to P = (10 - 0)/ (10 - 0) = 1 ms-2
Acceleration during P to Q = (10 - 10)/ (20 - 10) = 0 ms-2
Acceleration during Q to R = (0 - 10) / (25 -20) = - 2 ms-2.
APPEARS IN
RELATED QUESTIONS
Draw a velocity-time graph to show the following motion :
A car accelerates uniformly from rest for 5 s ; then it travels at a steady’ velocity for 5 s.
A body with an initial velocity x moves with a uniform acceleration y. Plot its velocity-time graph.
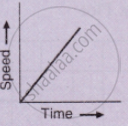
What type of motion is represented by the following graph ?
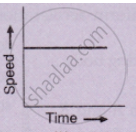
What type of motion is represented by the following graph ?
Draw velocity – time graph for the following situation:
When a body is moving with variable velocity, but uniform acceleration.
A ball is thrown up vertically and returns back to thrower in 6 s. Assuming there is no air friction, plot a graph between velocity and time. From the graph calculate
- deceleration
- acceleration
- total distance covered by ball
- average velocity.
What can you conclude if the speed-time graph of a body is a straight line sloping upwards and not passing through the origin?
Draw the following graph:
Speed versus time for a fluctuating speed.
Figure shows the distance-time graph of three students A, B and C. On the basis of the graph, answer the following :
How far did B travel between the time he passed C and A?
Slope of the velocity-time graph gives ______.
