Advertisements
Advertisements
प्रश्न
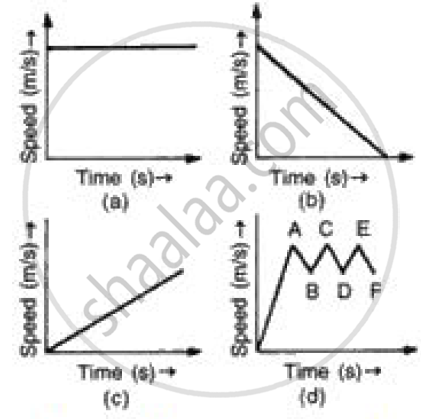
(i) In speed time graph uniform motion is given by a straight line parallel to x axis so figure (a) denotes the uniform motion.
(ii) In speed time graph motion with increasing speed is shown by straight line with positive slope so figure (c) denotes the motion with speed increasing.
(iii) In speed time graph motion with decreasing speed is shown by straight line with negative slope so figure (b) denotes the motion with speed decreasing.
(iv) In speed time graph motion with oscillating speed is shown by zigzag line so figure {d) denotes the motion with speed oscillating.
Advertisements
उत्तर
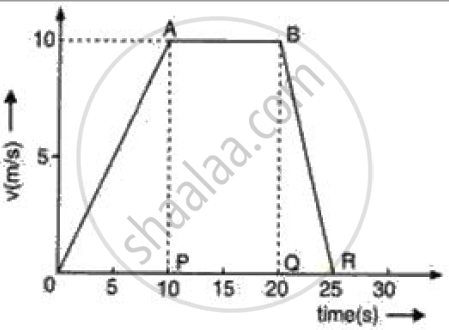
As we know that acceleration is given by the slope of the velocity-time graph so we have to calculate the slope of the graph of each stage of motion,
Acceleration during O to P = (10 - 0)/ (10 - 0) = 1 ms-2
Acceleration during P to Q = (10 - 10)/ (20 - 10) = 0 ms-2
Acceleration during Q to R = (0 - 10) / (25 -20) = - 2 ms-2.
APPEARS IN
संबंधित प्रश्न
The velocity-time graph for part of a train journey is a horizontal straight line. What does this tell you about its acceleration ?
A body with an initial velocity x moves with a uniform acceleration y. Plot its velocity-time graph.
Given alongside is the velocity-time graph for a moving body :
Find :
(i) Velocity of the body at point C.
(ii) Acceleration acting on the body between A and B.
(iii) Acceleration acting on the body between B and C.
What type of motion is represented by the following graph ?
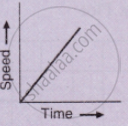
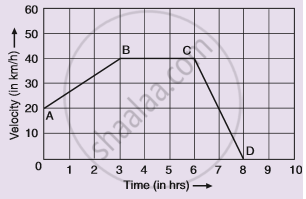
Diagram shows a velocity – time graph for a car starting from rest. The graph has three sections AB, BC, and CD.
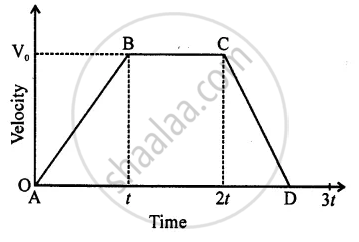
In which section, car has a zero acceleration?
Represent the position of a body described as at 15 m, 30o north of west, on a graph paper.
Draw the speed-time graph of a body starting from some point P, gradually picking up speed, then running at a uniform speed and finally slowing down to stop at some point Q.
What can you conclude if the speed-time graph of a body is a straight line sloping upwards and not passing through the origin?
Draw the following graph:
Speed versus time for a stepped motion
What does the slope of speed-time graph indicate?
