Advertisements
Advertisements
प्रश्न
Draw a velocity-time graph for the free fall of a body under gravity starting from rest. Take g = 10m s-2
Advertisements
उत्तर
Below is the velocity-time graph for the free fall of a body under gravity, starting from rest:

APPEARS IN
संबंधित प्रश्न
Show by means of graphical method that: v = u + at, where the symbols have their usual meanings.
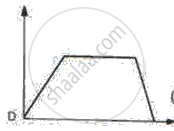
Diagram shows a velocity – time graph for a car starting from rest. The graph has three sections AB, BC and CD.

Compare the distance travelled in section BC with the distance travelled in section AB.
Diagram shows a velocity – time graph for a car starting from rest. The graph has three sections AB, BC, and CD.
In which section, car has a zero acceleration?
From the velocity – time graph given below, calculate Distance covered in the region ABCE.

Diagram is given below shows velocity – time graph of car P and Q, starting from the same place and in the same direction. Calculate which car is ahead after 10 s and by how much?

What can you conclude if the speed-time graph of a body is a straight line sloping upwards and not passing through the origin?
Given below are the speed -time graphs. Match them with their corresponding motions :
 |
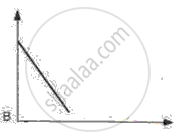
(a) Uniformity retared motion |
 |
(b) Non-uniformity acceleration |
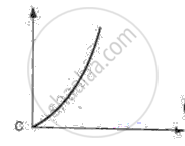 |
(c) Non-uniform motion |
 |
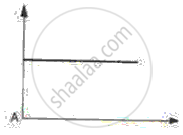
(d) uniform motion |
What does the slope of speed-time graph indicate?
What can you say about the nature of motion of a body of its displacement-time graph is:
A straight line inclined to the time axis with an acute angle?
What can you say about the motion of a body if:
Its time-velocity graph is a straight line
