Advertisements
Advertisements
प्रश्न
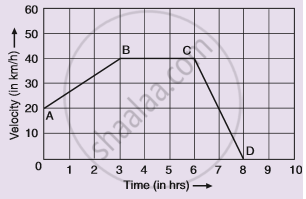
From the velocity – time graph given below, calculate Distance covered in the region ABCE.

Advertisements
उत्तर
Distance covered in region ABCE = ar(ΔABF) + area of trapezium BCEF
= `1/2xx"AF"xx"BF"+1/2("BF+CF")xx"GC"`
= `1/2xx12xx14+1/2(14+6)xx4`
= 6 × 14 + 10 × 4
= 84 + 40
= 124 m
APPEARS IN
संबंधित प्रश्न
Fill in the following blank with suitable word :
In a speed-time graph, the area enclosed by the speed-time curve and the time axis gives the…………….. by the body.
Given alongside is the velocity-time graph for a moving body :
Find :
(i) Velocity of the body at point C.
(ii) Acceleration acting on the body between A and B.
(iii) Acceleration acting on the body between B and C.
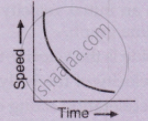
What type of motion is represented by the following graph ?
A car of mass 1000 kg is moving with a velocity of 10 m s−1. If the velocity-time graph for this car is a horizontal line parallel to the time axis, then the velocity of car at the end of 25 s will be :
A ball is thrown up vertically and returns back to thrower in 6 s. Assuming there is no air friction, plot a graph between velocity and time. From the graph calculate
- deceleration
- acceleration
- total distance covered by ball
- average velocity.
How does the slope of a speed-time graph give the acceleration of a body moving along a straight line?
How will you use a speed-time graph to find whether the acceleration of the body is uniform or not?
Its time-displacement graph is a straight line.
Draw distance-time graph to show:
Increasing velocity
A straight line parallel to the x-axis in the velocity-time graph represents the object moving in ______.
