Advertisements
Advertisements
प्रश्न
Draw the speed-time graph of a body when its initial speed is not zero and the speed increases uniformly with time.
Advertisements
उत्तर

Speed time graph of a body when itS Initial speed is not ze ro and and speed increase uniformly with time.
APPEARS IN
संबंधित प्रश्न
A car of mass 1000 kg is moving with a velocity of 10 m s−1. If the velocity-time graph for this car is a horizontal line parallel to the time axis, then the velocity of car at the end of 25 s will be :
Draw a displacement-time graph for a boy going to school with uniform velocity.
Multiple choice Question. Select the correct option.
The slope of displacement – time graph represents.
Diagram shows a velocity – time graph for a car starting from rest. The graph has three sections AB, BC, and CD.
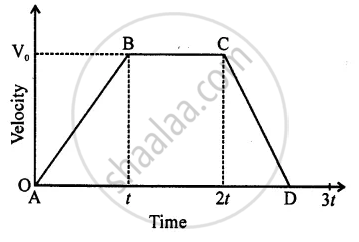
Is the magnitude of acceleration higher or lower than that of retardation? Give a reason.
A ball is thrown up vertically and returns back to thrower in 6 s. Assuming there is no air friction, plot a graph between velocity and time. From the graph calculate
- deceleration
- acceleration
- total distance covered by ball
- average velocity.
A body at rest is thrown downward from the top of the tower. Draw a distance – time graph of its free fall under gravity during the first 3 seconds. Show your table of values starting t = 0 with an interval of 1 second, (g = 10 ms−2).
The area under a speed-time graph in a given intervals gives the total distance covered by a body irrespective of its motion being uniform or non-uniform.
Draw the following graph:
Speed versus time for a fluctuating speed.
What can you say about the motion of a body if:
Its time-velocity graph is a straight line
Draw velocity-time graph to show:
Acceleration
Write a sentence to explain the shape of graph.
