Advertisements
Advertisements
प्रश्न
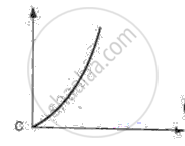
The area under a speed-time graph in a given intervals gives the total distance covered by a body irrespective of its motion being uniform or non-uniform.
Advertisements
उत्तर
Yes area under a speed time graph in a given interval gives the total distance covered by a body.
APPEARS IN
संबंधित प्रश्न
Fill in the following blank with suitable word :
In a speed-time graph, the area enclosed by the speed-time curve and the time axis gives the…………….. by the body.
The velocity-time graph for part of a train journey is a horizontal straight line. What does this tell you about its acceleration ?
What can you say about the motion of a body if:
its displacement-time graph is a straight line ?
What can you conclude if the speed-time graph of a body is a straight line sloping upwards and not passing through the origin?
Draw the following graph:
Distance versus time for a body at rest.
Draw the following graph:
Speed versus time for a fluctuating speed.
Given below are the speed -time graphs. Match them with their corresponding motions :
 |
(a) Uniformity retared motion |
 |
(b) Non-uniformity acceleration |
 |
(c) Non-uniform motion |
 |
(d) uniform motion |
Saphira moves at a constant speed in the same direction. Rephrase the same sentence in fewer words using concepts related to motion.
State whether true or false. If false, correct the statement.
If the velocity – time graph of a particle is a straight line inclined to X-axis then its displacement – time graph will be a straight line.
The area under the v-t graph represents a physical quantity that has the unit.
