Advertisements
Advertisements
प्रश्न
Draw the following graph:
Speed versus time for a fluctuating speed.
Advertisements
उत्तर
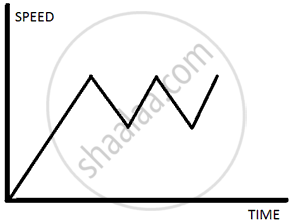
Speed time graph for a body showing fluctuating speed.
APPEARS IN
संबंधित प्रश्न
Name the two quantities, the slope of whose graph give acceleration.
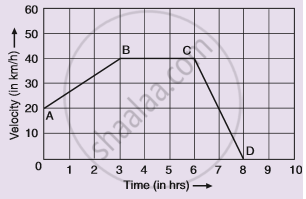
Given alongside is the velocity-time graph for a moving body :
Find :
(i) Velocity of the body at point C.
(ii) Acceleration acting on the body between A and B.
(iii) Acceleration acting on the body between B and C.
A body is moving uniformly in a straight line with a velocity of 5 m/s. Find graphically the distance covered by it in 5 seconds.
Draw a velocity-time graph for the free fall of a body under gravity starting from rest. Take g = 10m s-2
Diagram shows a velocity – time graph for a car starting from rest. The graph has three sections AB, BC, and CD.

In which section, car has a zero acceleration?
What can you conclude if the speed-time graph of a body is a curve moving upwards starting from the origin?
Draw the following graph:
Speed versus time for a non-uniform acceleration.
Draw the following graph:
Distance versus time for a body at rest.
Draw distance-time graph to show:
Uniform velocity
Draw distance-time graph to show:
Decreasing velocity
