Advertisements
Advertisements
Question
Draw the following graph:
Speed versus time for a fluctuating speed.
Advertisements
Solution
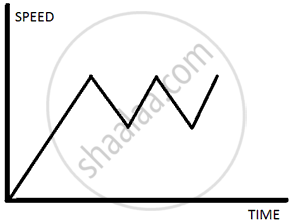
Speed time graph for a body showing fluctuating speed.
APPEARS IN
RELATED QUESTIONS
Fill in the following blank with suitable word :
In a speed-time graph, the area enclosed by the speed-time curve and the time axis gives the…………….. by the body.
What can you say about the motion of a body if:
its displacement-time graph is a straight line ?
What does the slope of a displacement-time graph represent?
Draw velocity – time graph for the following situation:
When a body, is moving with uniform velocity.
Name the physical quantity which is equal to the area under speed-time graph.
Draw the following graph:
Speed versus time for a stepped motion
Draw distance-time graph to show:
Increasing velocity
Draw distance-time graph to show:
Decreasing velocity
Derive the equation
S = ut+ `1/2` at2
Using a speed- time graph
Mention the uses of the velocity-time graph.
