Advertisements
Advertisements
Question
Draw the following graph:
Speed versus time for a stepped motion
Advertisements
Solution
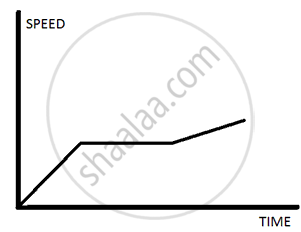
Speed time graph for a stepped motion
APPEARS IN
RELATED QUESTIONS
Draw a velocity-time graph to show the following motion :
A car accelerates uniformly from rest for 5 s ; then it travels at a steady’ velocity for 5 s.
A body is moving uniformly in a straight line with a velocity of 5 m/s. Find graphically the distance covered by it in 5 seconds.
Draw velocity – time graph for the following situation:
When a body is moving with variable velocity, but uniform acceleration.
A body at rest is thrown downward from the top of the tower. Draw a distance – time graph of its free fall under gravity during the first 3 seconds. Show your table of values starting t = 0 with an interval of 1 second, (g = 10 ms−2).
From the velocity – time graph given below, calculate Average velocity in region CED.

Diagram is given below shows velocity – time graph of car P and Q, starting from the same place and in the same direction. Calculate at what time intervals both cars have the same velocity?

The area under a speed-time graph in a given intervals gives the total distance covered by a body irrespective of its motion being uniform or non-uniform.
What does the slope of speed-time graph indicate?
Figure shows the distance-time graph of three students A, B and C. On the basis of the graph, answer the following :
Will the three ever meet at any point on the road?
State whether true or false. If false, correct the statement.
If the velocity – time graph of a particle is a straight line inclined to X-axis then its displacement – time graph will be a straight line.
