Advertisements
Advertisements
Question
Diagram is given below shows velocity – time graph of car P and Q, starting from the same place and in the same direction. Calculate at what time intervals both cars have the same velocity?

Advertisements
Solution

Both cars have the same velocity at t = 3 s and at t = 7 s.
APPEARS IN
RELATED QUESTIONS
Multiple choice Question. Select the correct option.
A graph is a straight line parallel to the time axis in a distance-time graph. From the graph, it implies:
Multiple choice Question. Select the correct option.
The slope of displacement – time graph represents.
Draw velocity – time graph for the following situation:
When a body, is moving with uniform velocity.
The graph of one quantity versus another result in a straight line. How are the quantities related to each other?
What can you conclude if the speed-time graph of a body is a curve moving upwards starting from the origin?
Its time-displacement graph is a straight line.
Draw distance-time graph to show:
Decreasing velocity
Interpret the following graph: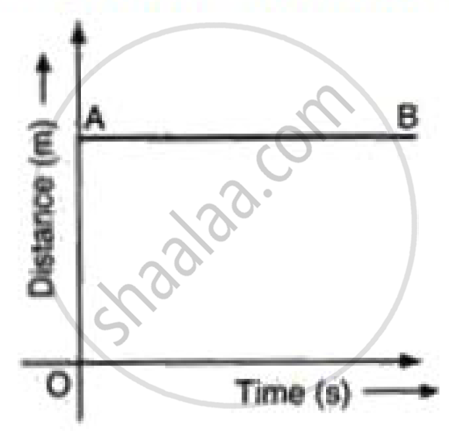
State whether true or false. If false, correct the statement.
If the velocity – time graph of a particle is a straight line inclined to X-axis then its displacement – time graph will be a straight line.
If the velocity-time graph has the shape AMB, what would be the shape of the corresponding acceleration-time graph?

