Advertisements
Advertisements
प्रश्न
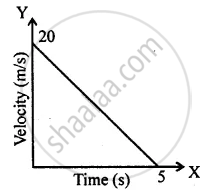
Diagram is given below shows velocity – time graph of car P and Q, starting from the same place and in the same direction. Calculate at what time intervals both cars have the same velocity?

Advertisements
उत्तर

Both cars have the same velocity at t = 3 s and at t = 7 s.
APPEARS IN
संबंधित प्रश्न
Draw a velocity-time graph to show the following motion :
A car accelerates uniformly from rest for 5 s ; then it travels at a steady’ velocity for 5 s.
What can you say about the motion of a body if:
its displacement-time graph is a straight line ?
Draw a displacement-time graph for a boy going to school with uniform velocity.
Multiple choice Question. Select the correct option.
The distance covered in the adjoining velocity-time graph is :
From the velocity – time graph given below, calculate acceleration in the region AB.

What can you conclude if the speed-time graph of a body is a straight line sloping upwards and not passing through the origin?
Draw the following graph:
Speed versus time for a stepped motion
Draw distance-time graph to show:
Increasing velocity
Draw distance-time graph to show:
Uniform velocity
Figure shows the distance-time graph of three students A, B and C. On the basis of the graph, answer the following :
Will the three ever meet at any point on the road?
