Advertisements
Advertisements
प्रश्न
Draw a velocity-time graph to show the following motion :
A car accelerates uniformly from rest for 5 s ; then it travels at a steady’ velocity for 5 s.
Advertisements
उत्तर
we have to draw a velocity verses time curve for a moving body . 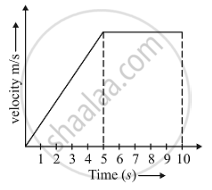
APPEARS IN
संबंधित प्रश्न
Show by means of graphical method that: v = u + at, where the symbols have their usual meanings.
Define speed. What is its S.I. unit?
What does the slope of velocity-time graph represent?
For uniform motion _________
Draw velocity – time graph for the following situation:
When a body, is moving with uniform velocity.
Diagram shows a velocity – time graph for a car starting from rest. The graph has three sections AB, BC, and CD.

In which section, car has a zero acceleration?
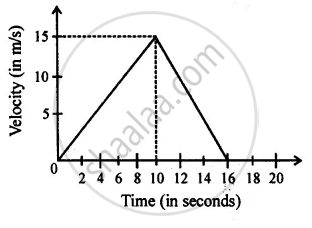
From the diagram given below, calculate distance covered by body.
The graph of one quantity versus another result in a straight line. How are the quantities related to each other?
Draw the following graph:
Distance versus time for a body at rest.
Figure shows the distance-time graph of three students A, B and C. On the basis of the graph, answer the following :
Which of the three is traveling the fastest?
