Advertisements
Advertisements
प्रश्न
The graph of one quantity versus another result in a straight line. How are the quantities related to each other?
Advertisements
उत्तर
Two quantities are directly proportional to each other.
APPEARS IN
संबंधित प्रश्न
A body with an initial velocity x moves with a uniform acceleration y. Plot its velocity-time graph.
Study the speed-time graph of a car given alongside and answer the following questions:
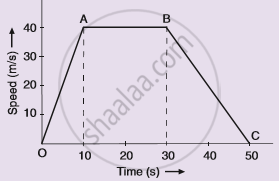
(i) What type of motion is represented by OA ?
(ii) What type of motion is represented by AB ?
(iii) What type of motion is represented by BC ?
(iv) What is the acceleration of car from O to A ?
(v)What is the acceleration of car from A to B ?
(vi) What is the retardation of car from B to C ?
Multiple choice Question. Select the correct option.
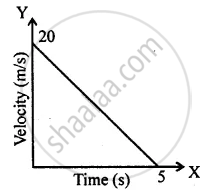
The distance covered in the adjoining velocity-time graph is :
Draw velocity – time graph for the following situation:
When a body, is moving with uniform velocity.
How will you use a speed-time graph to find whether the acceleration of the body is uniform or not?
What does the slope of speed-time graph indicate?
What can you say about the nature of motion of a body of its displacement-time graph is:
A straight line inclined to the time axis with an acute angle?
What does the slope of velocity-time graph represent?
Figure shows the velocity-time graphs for two objects A and B moving in same direction . Which object has the greater a cceleration?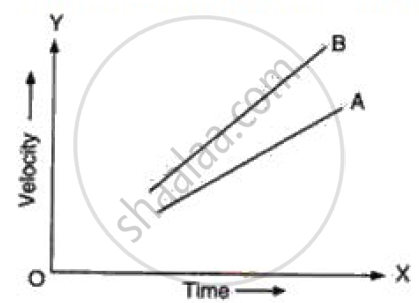
The velocity-displacement graph describing the motion of a bicycle is shown in the figure.

The acceleration-displacement graph of the bicycle's motion is best described by:
