Advertisements
Advertisements
प्रश्न
Multiple choice Question. Select the correct option.
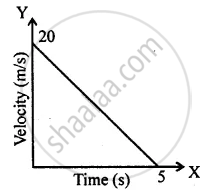
The distance covered in the adjoining velocity-time graph is :
विकल्प
25 m
40 m
50 m
45 m
Advertisements
उत्तर
50 m
Explanation:
Distance covered = Area under velocity – time graph
=1/2 × base × height
a = 1/2 × 5 × 20 = 50 m
APPEARS IN
संबंधित प्रश्न
What does the slope of a speed-time graph indicate ?
The velocity-time graph for part of a train journey is a horizontal straight line. What does this tell you about the trains velocity.
What can you say about the motion of a body if:
its displacement-time graph is a straight line ?
Multiple choice Question. Select the correct option.
A graph is a straight line parallel to the time axis in a distance-time graph. From the graph, it implies:
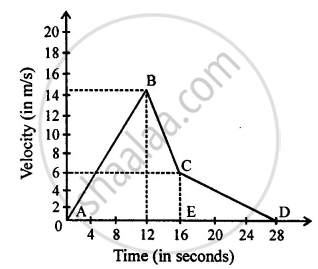
From the velocity – time graph given below, calculate Average velocity in region CED.
Draw the following graph:
Speed versus time for a uniformly retarded motion.
Interpret the following graph: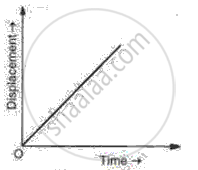
Draw distance-time graph to show:
Increasing velocity
Mention the uses of the velocity-time graph.
The velocity-displacement graph describing the motion of a bicycle is shown in the figure.

The acceleration-displacement graph of the bicycle's motion is best described by:
